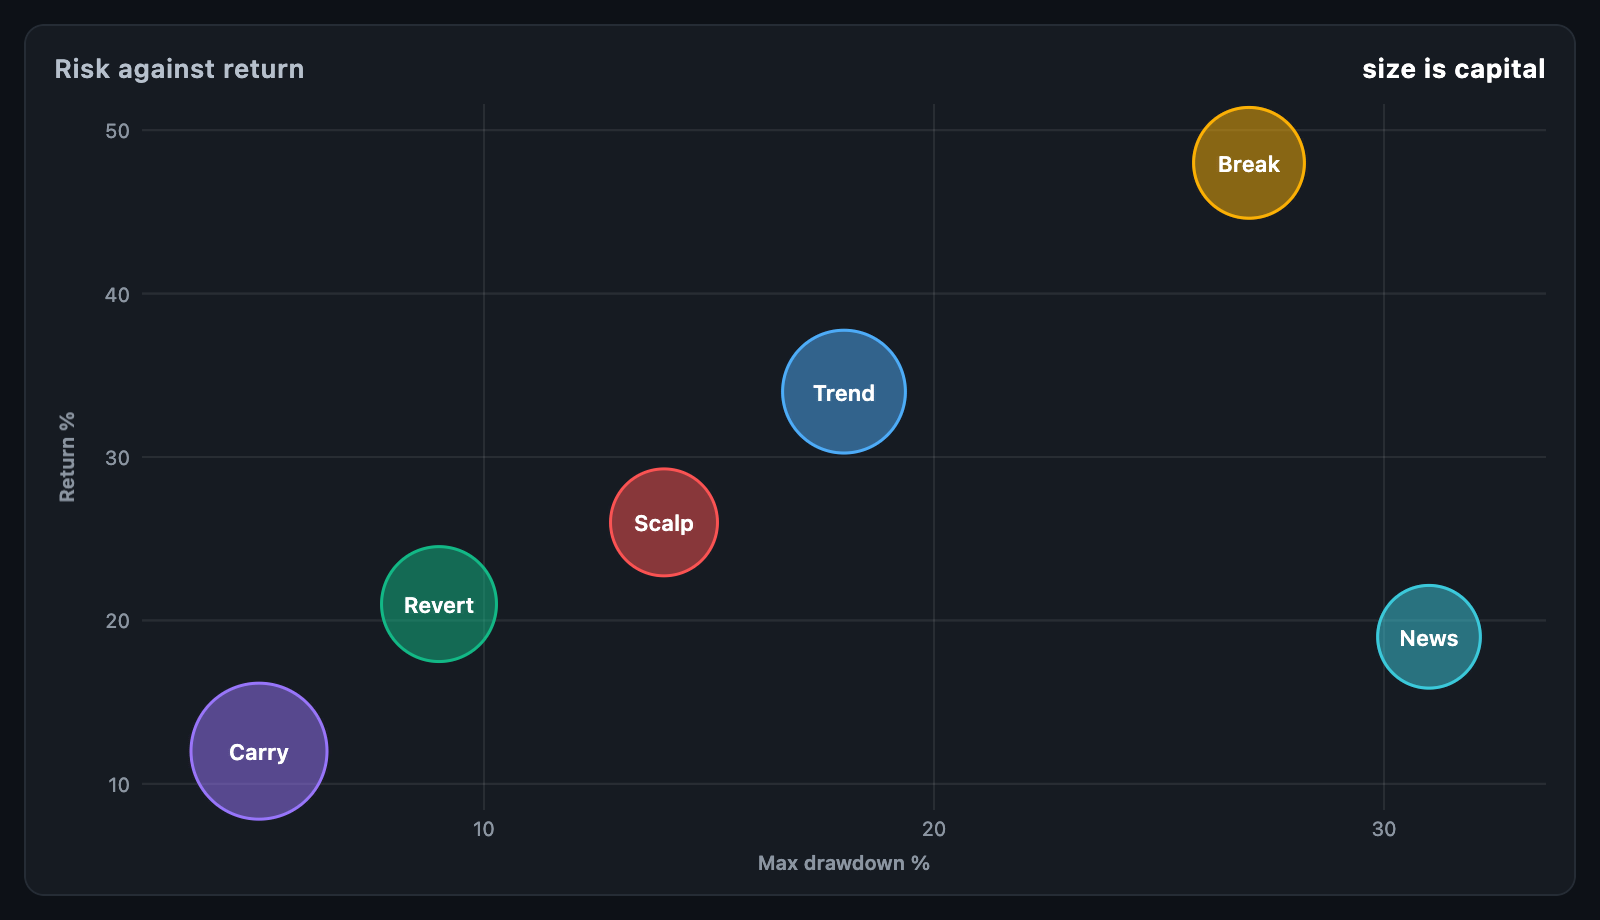
BubbleChart compares three numbers at once: two positions and a size. Typical
uses include risk against return with position size, spread against volume with
trade count, and market cap maps.
BubbleChart(
  points: const [
    BubblePoint(x: 8.2, y: 14.5, size: 120000, label: 'Trend'),
    BubblePoint(x: 15.1, y: 21.0, size: 40000, label: 'Breakout'),
  ],
  xAxisTitle: 'Volatility %',
  yAxisTitle: 'Return %',
  yReferenceLines: const [0],
);
The chart fills its constraints. When the height is unbounded, it uses
defaultHeight.
| Field | Description |
|---|---|
x, y |
Position on the two axes |
size |
Sets the bubble's area, so a value twice as large covers twice the area |
label |
Written inside the bubble when it fits |
color |
Fixed colour; otherwise taken from palette in order |
data |
Arbitrary app data, returned on touch |
| Parameter | Description |
|---|---|
minX, maxX, minY, maxY |
Axis ends; null reads them off the points with 10% padding |
minRadius, maxRadius |
The radii the sizes are spread between |
maxSize |
What maxRadius is worth; null takes the largest point |
padding |
Space around the chart |
bubbleRange(points) returns the ranges the chart would pick,
layOutBubbles(points, bounds, …) returns the BubbleCircle list it paints, and
bubbleAt(circles, local) hit-tests it — the smallest bubble wins, so one
sitting inside a larger one can still be picked. All three are public, so a
layout can be computed and tested without a widget.
| Parameter | Description |
|---|---|
palette |
Colours taken in turn by bubbles without one |
fillOpacity |
How opaque a bubble's fill is; the outline is solid |
strokeWidth |
Outline weight |
showLabels, labelStyle |
Names written inside the bubbles that can hold them |
showAxes, axisWidth, axisHeight |
The two axes and their room |
tickCount, xFormatter, yFormatter, axisLabelStyle |
Axis ticks and labels |
xAxisTitle, yAxisTitle, axisTitleStyle |
Axis titles |
gridColor |
Grid ruled at each tick; null rules none |
xReferenceLines, yReferenceLines, referenceColor |
Lines marking benchmarks, zero or targets |
hoverBorder |
Drawn round the bubble under the pointer |
backgroundColor |
Painted behind the chart |
Bubbles are painted largest first, so a small one is never buried, and axis labels that would collide are dropped.
onTouch reports a BubbleTouchDetails with the circle and its point, and
null when the pointer leaves.
BubbleChart(
  points: points,
  onTouch: (details) => setState(() => _selected = details?.point.data),
  tooltipBuilder: (context, details) => Card(
    child: Padding(
      padding: const EdgeInsets.all(8),
      child: Text('${details.point.label}\n'
          'size ${details.point.size}'),
    ),
  ),
);animationDuration grows the bubbles in from nothing; animationCurve eases it
and animateOnMount controls whether the first build animates. The chart
animates again whenever points changes identity.