



I'm Avalon. I turn public data into maps, charts, and arguments.




My background is in Computer Science and Computer Engineering. My craft is alchemy: I take the public data nobody bothers to read and turn it into something people can see, touch, and argue about. Current obsessions: how much power and water the machines drink, who gets blamed every time Bitcoin bleeds, and what the archipelago looks like under the all-seeing eye.
Every project ships with a built-in learning mode, because a chart you can't explain is just decoration.
- ⚡ Now: interactive dashboards on open data, Python first
- 🧭 Next: machine learning and heavier geospatial work
- 💬 Talk to me about data centers, energy, markets, and maps
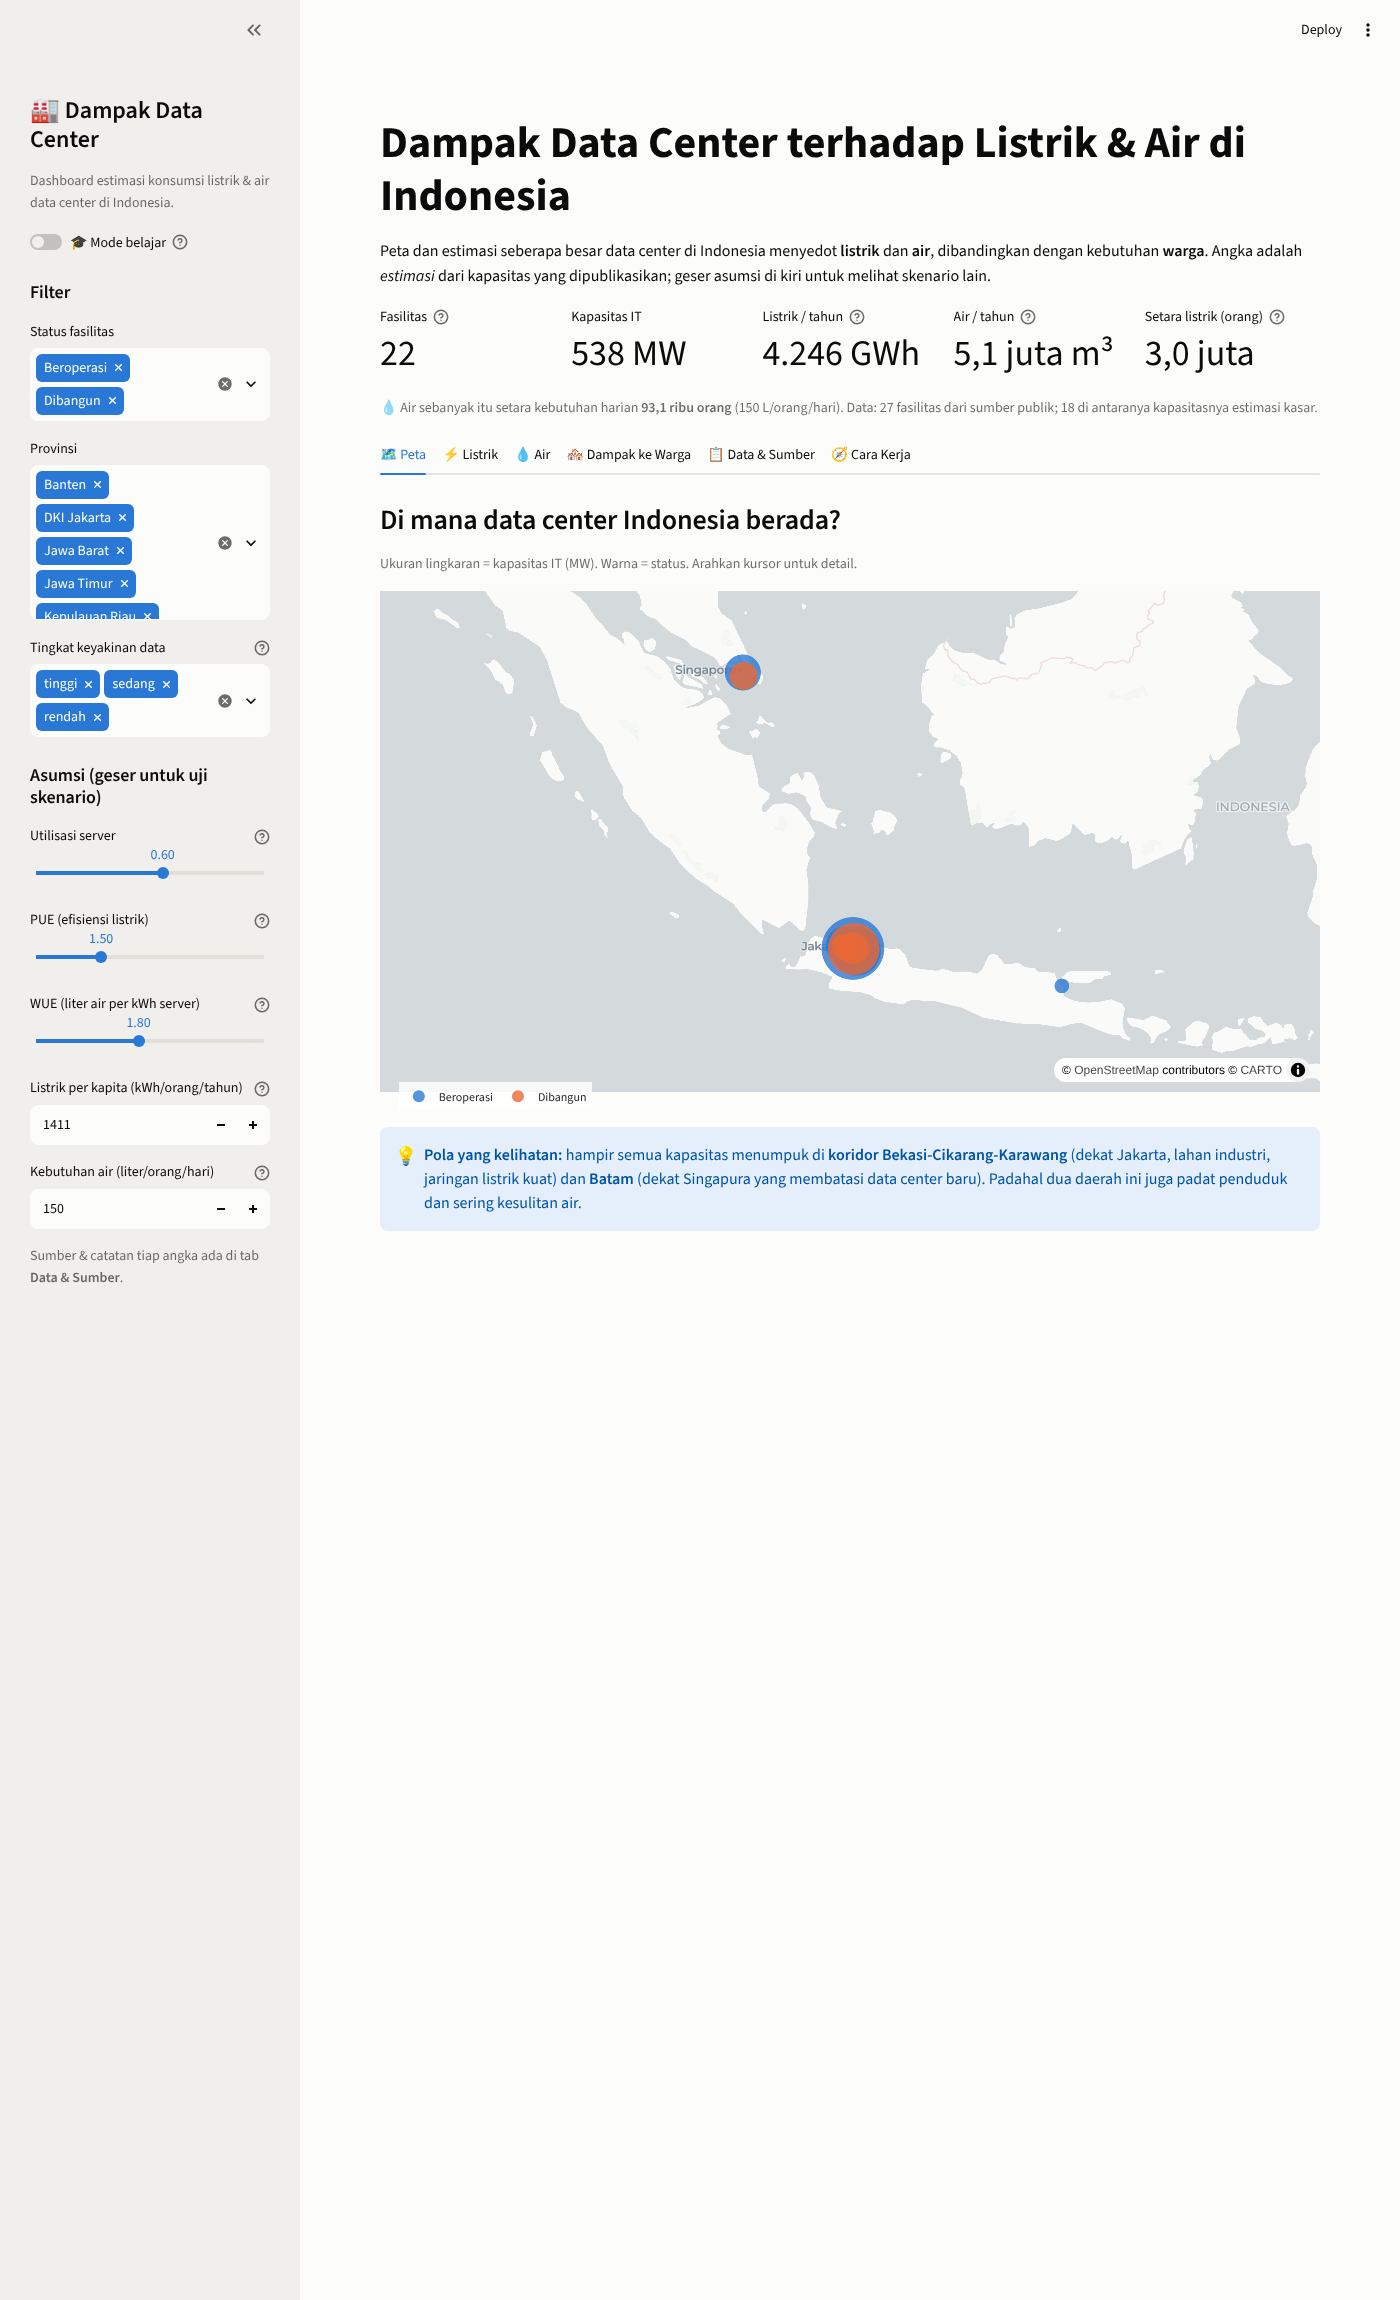
The machines are thirsty. An interactive map exposing how much electricity and water Indonesia's data centers devour, and how many residents end up sharing the bill. Tweak the assumptions, watch the numbers move.
|
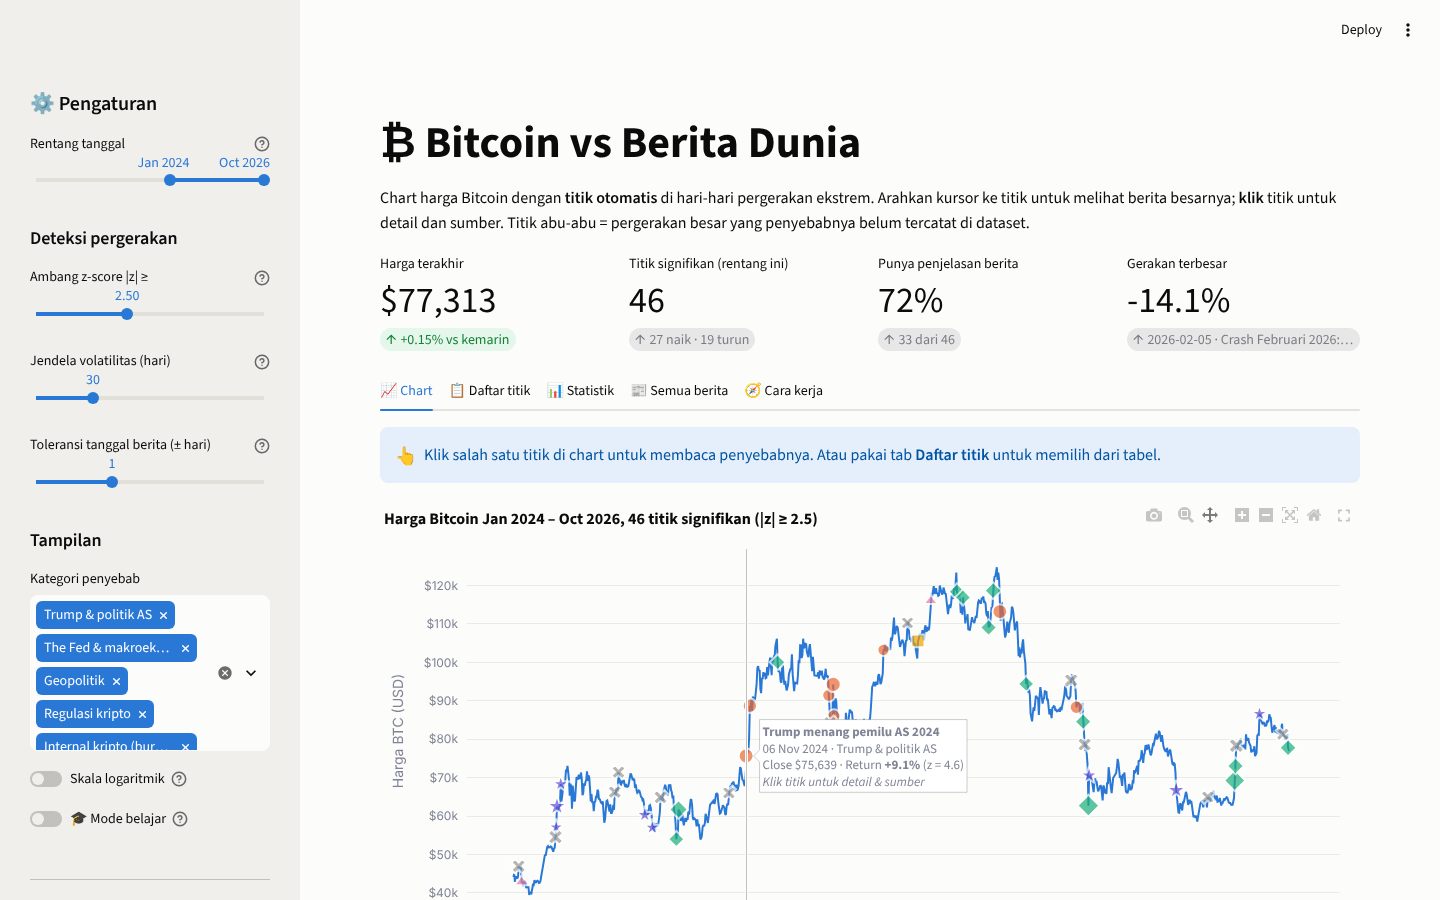
Every Bitcoin crash has a suspect. An interactive chart that flags Bitcoin's wildest days and drags the usual suspects to the table: Trump, the Fed, wars, regulators, collapsing exchanges. Hover for the motive, click for the evidence.
|
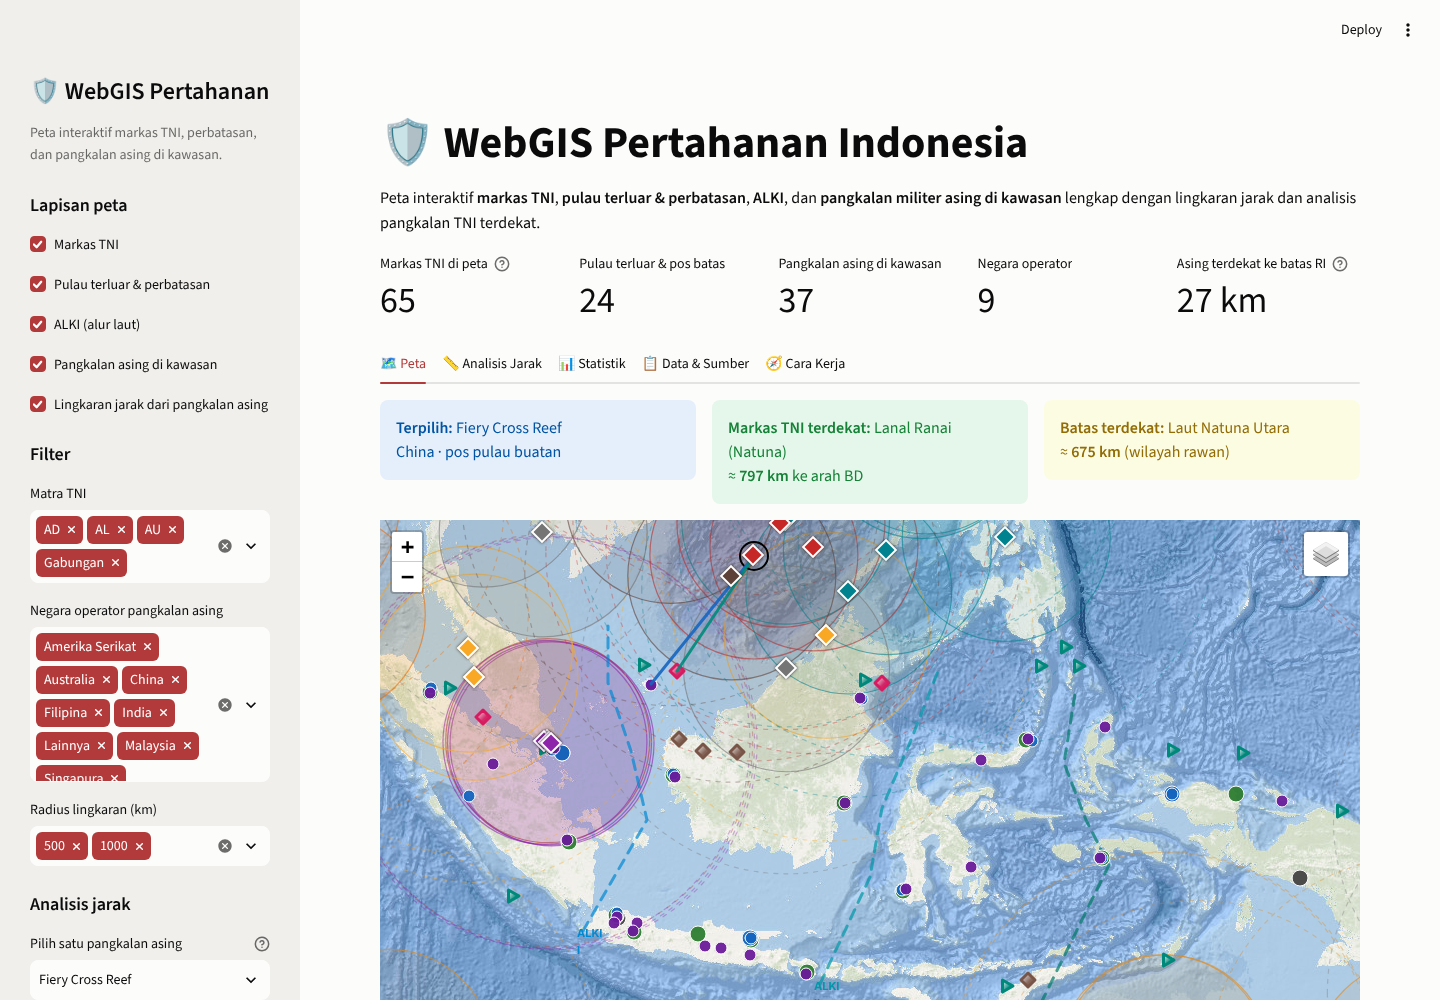
The archipelago, under the all-seeing eye. A WebGIS of Indonesia's defense geography: TNI bases, outermost islands, sea lanes and foreign bases in the region on one map, with range rings and nearest-base analysis. Public data only, no state secrets harmed.
|
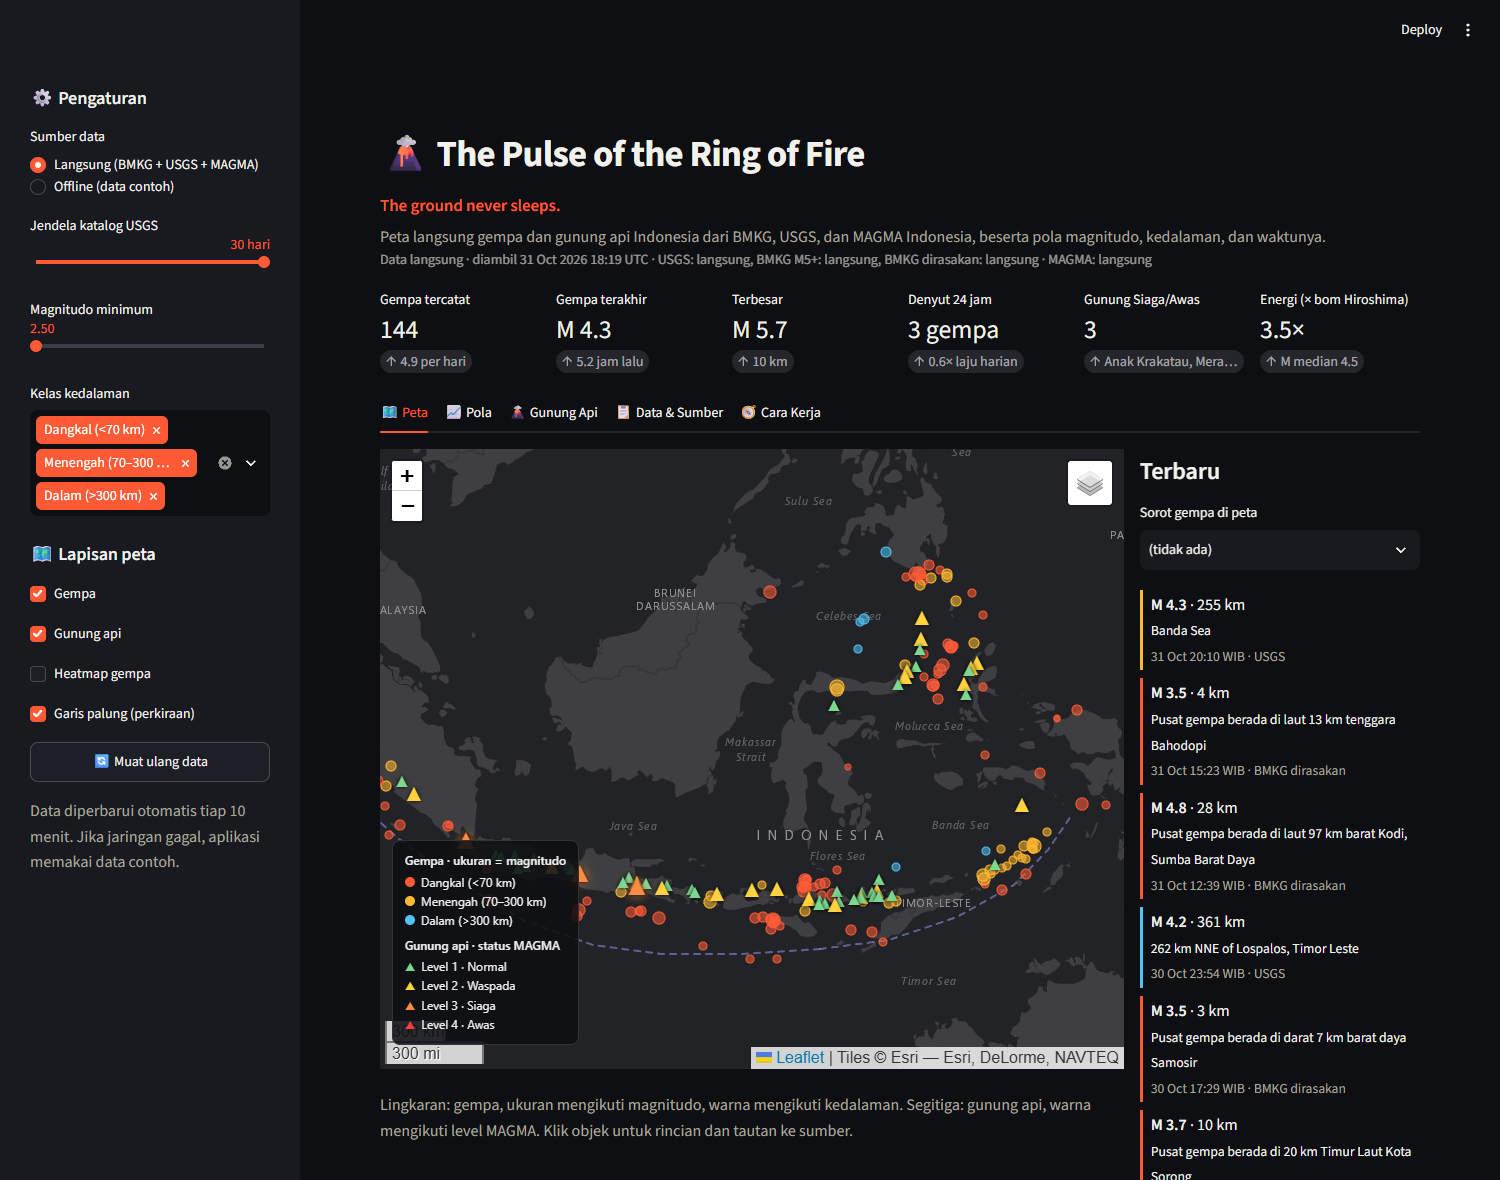
The ground never sleeps. A live map of Indonesia's earthquakes and volcanoes, fed by public BMKG, USGS and MAGMA feeds: magnitude, depth and timing patterns, Gutenberg–Richter b-values, and volcano alert levels. Not an early-warning system, just the pulse made visible.
|
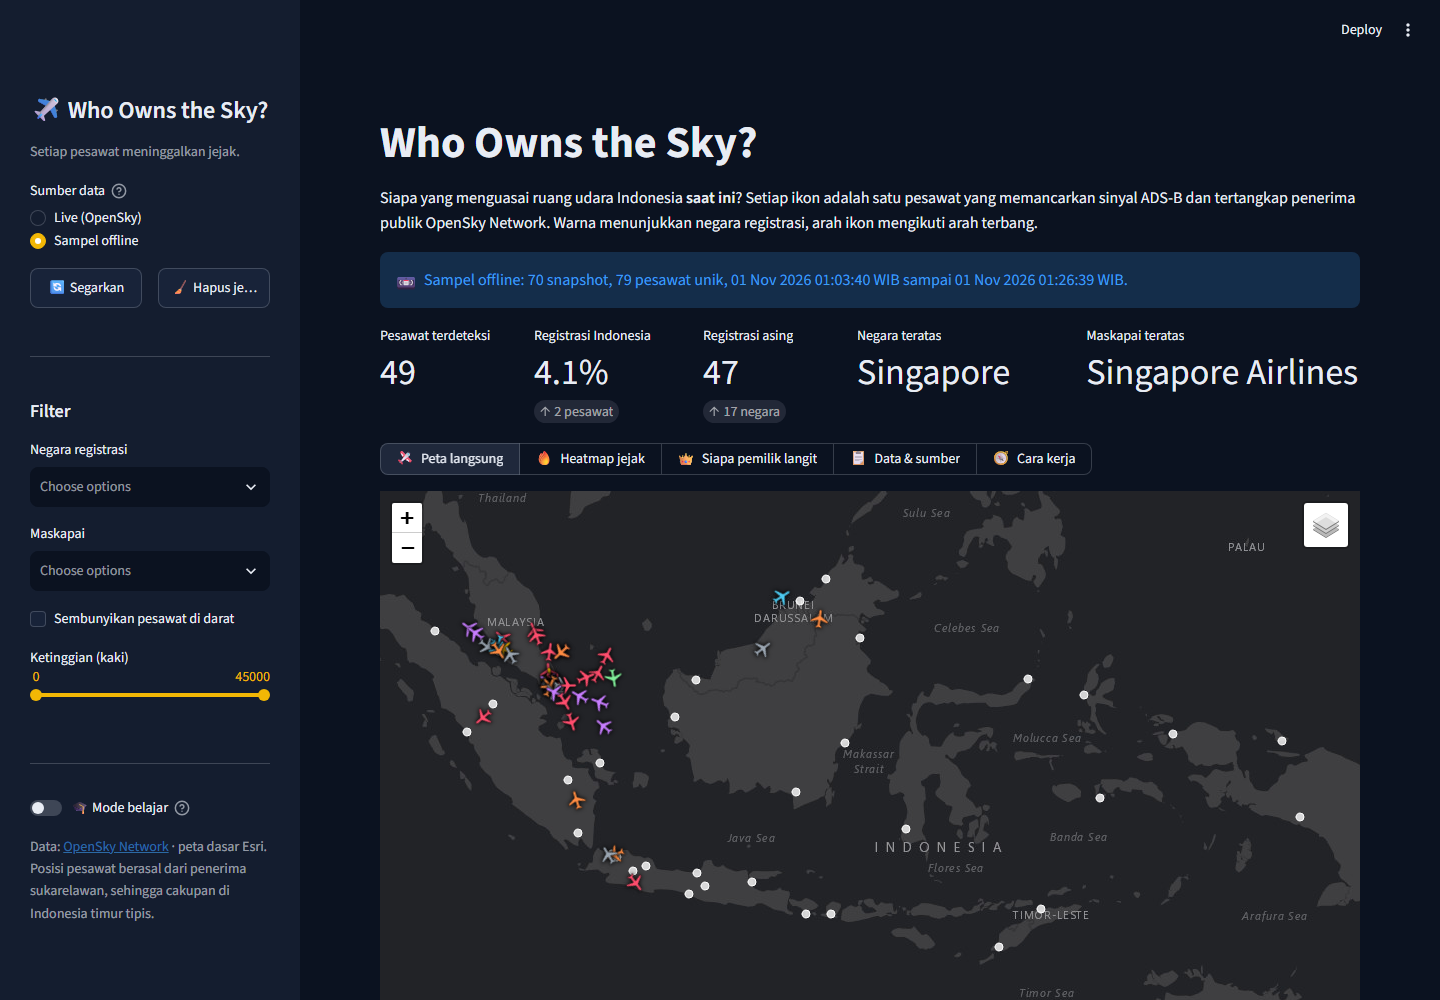
Every plane leaves a trail. A live map of every aircraft over Indonesia from public ADS-B data (OpenSky Network), with a heatmap of the busiest corridors and a running answer to one question: who owns the sky right now?
|
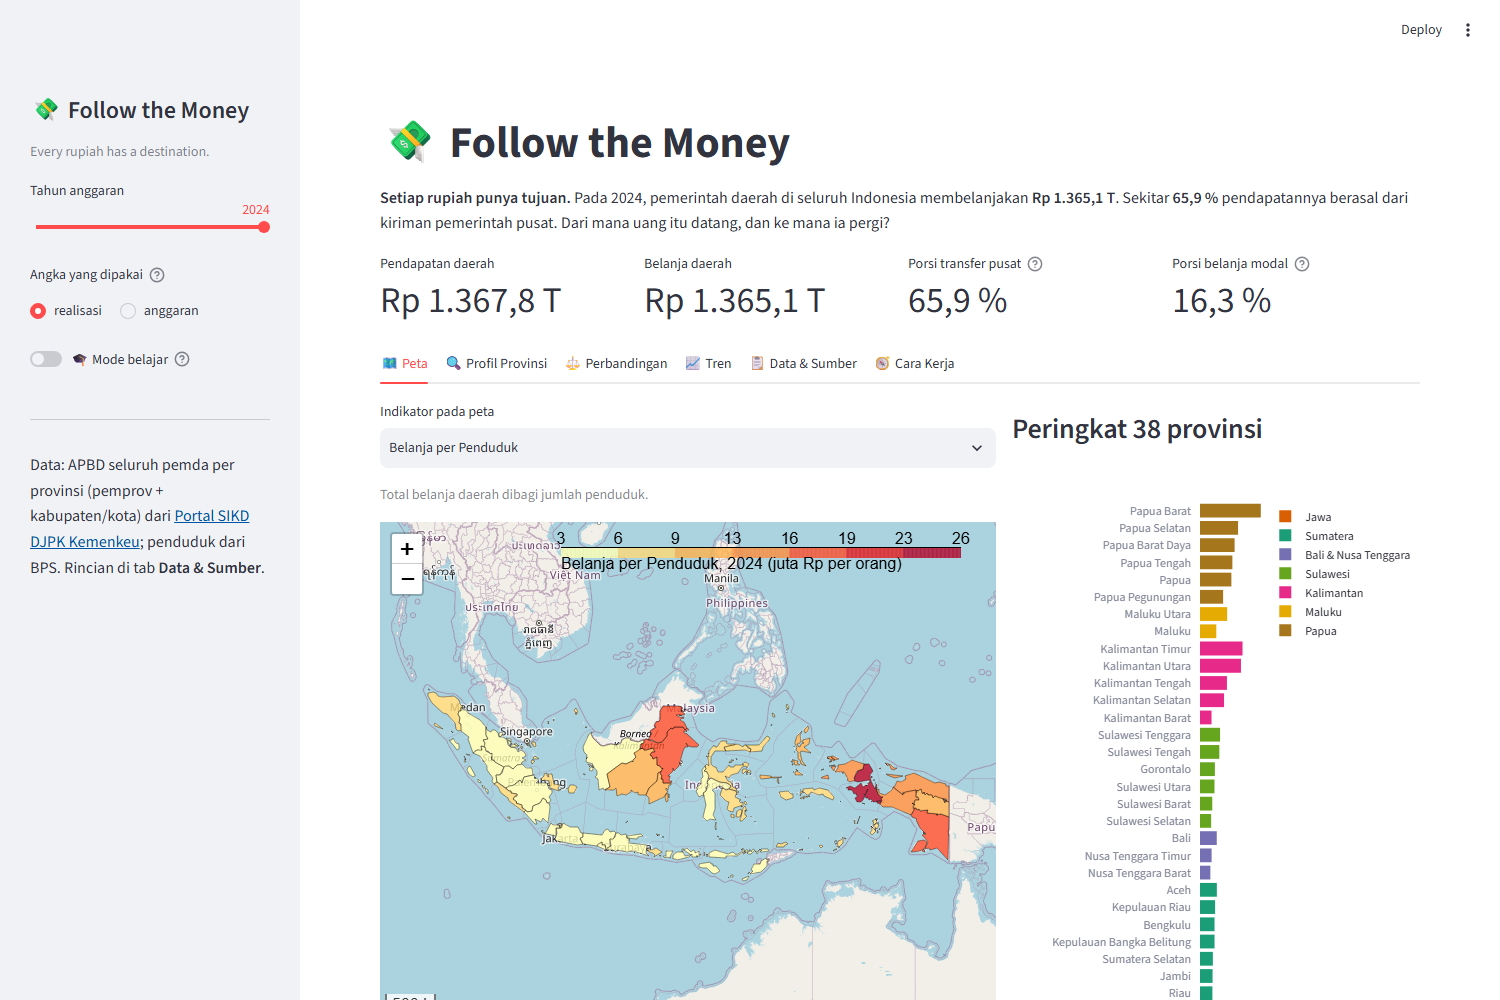
Every rupiah has a destination. An interactive dashboard of regional government finances across 38 Indonesian provinces: where the money comes from, where it goes, and how the map flips the moment you divide by population. Public data, no spin.
|
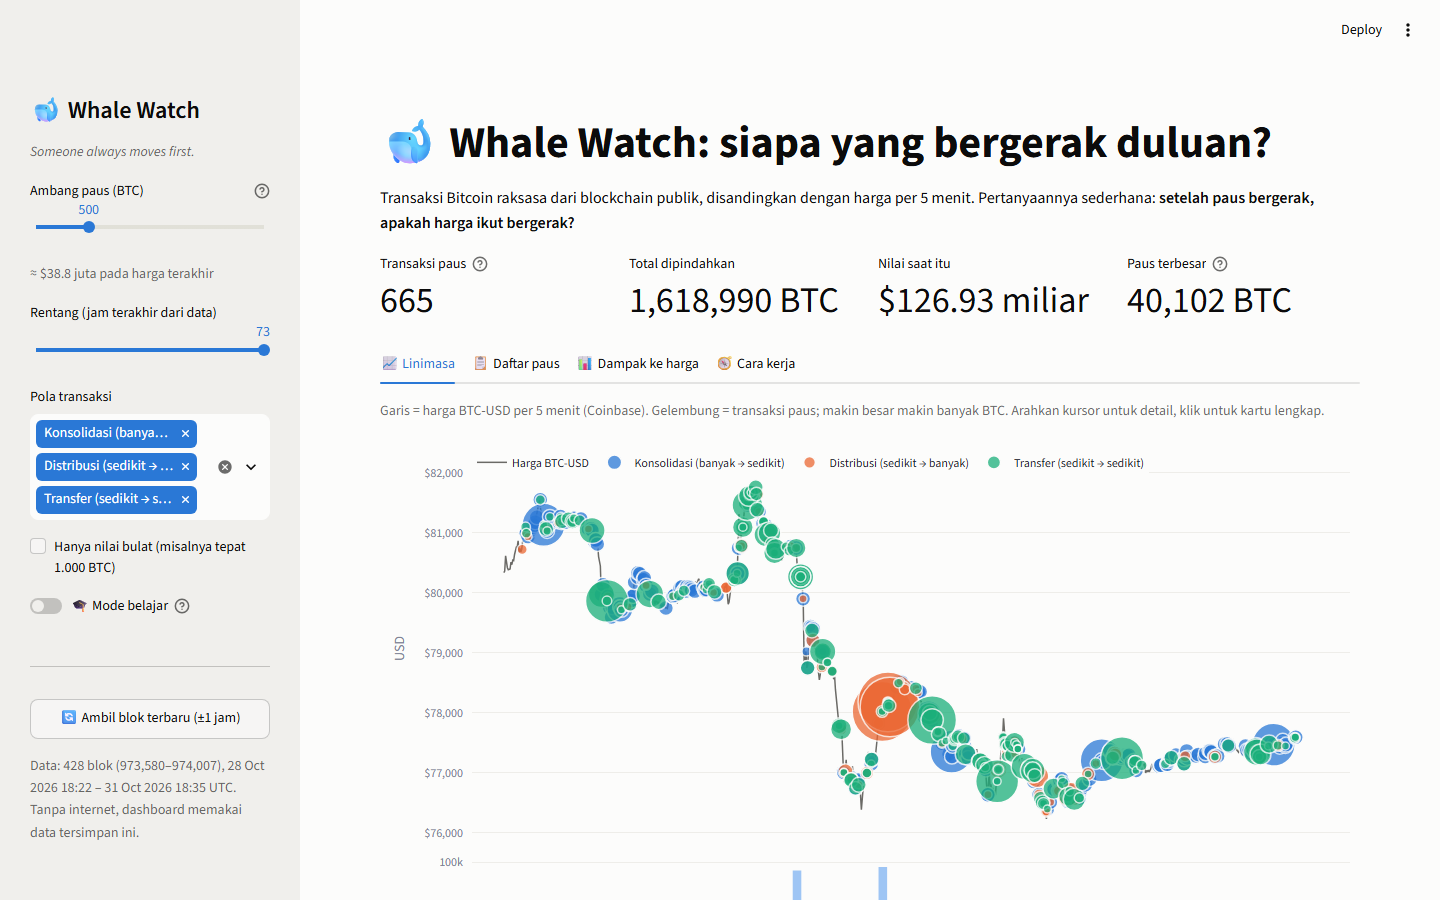
Someone always moves first. Tracks giant Bitcoin transactions straight from the public blockchain, lines them up against 5-minute price candles, and asks the honest question: do whales move the price, or just follow it?
|
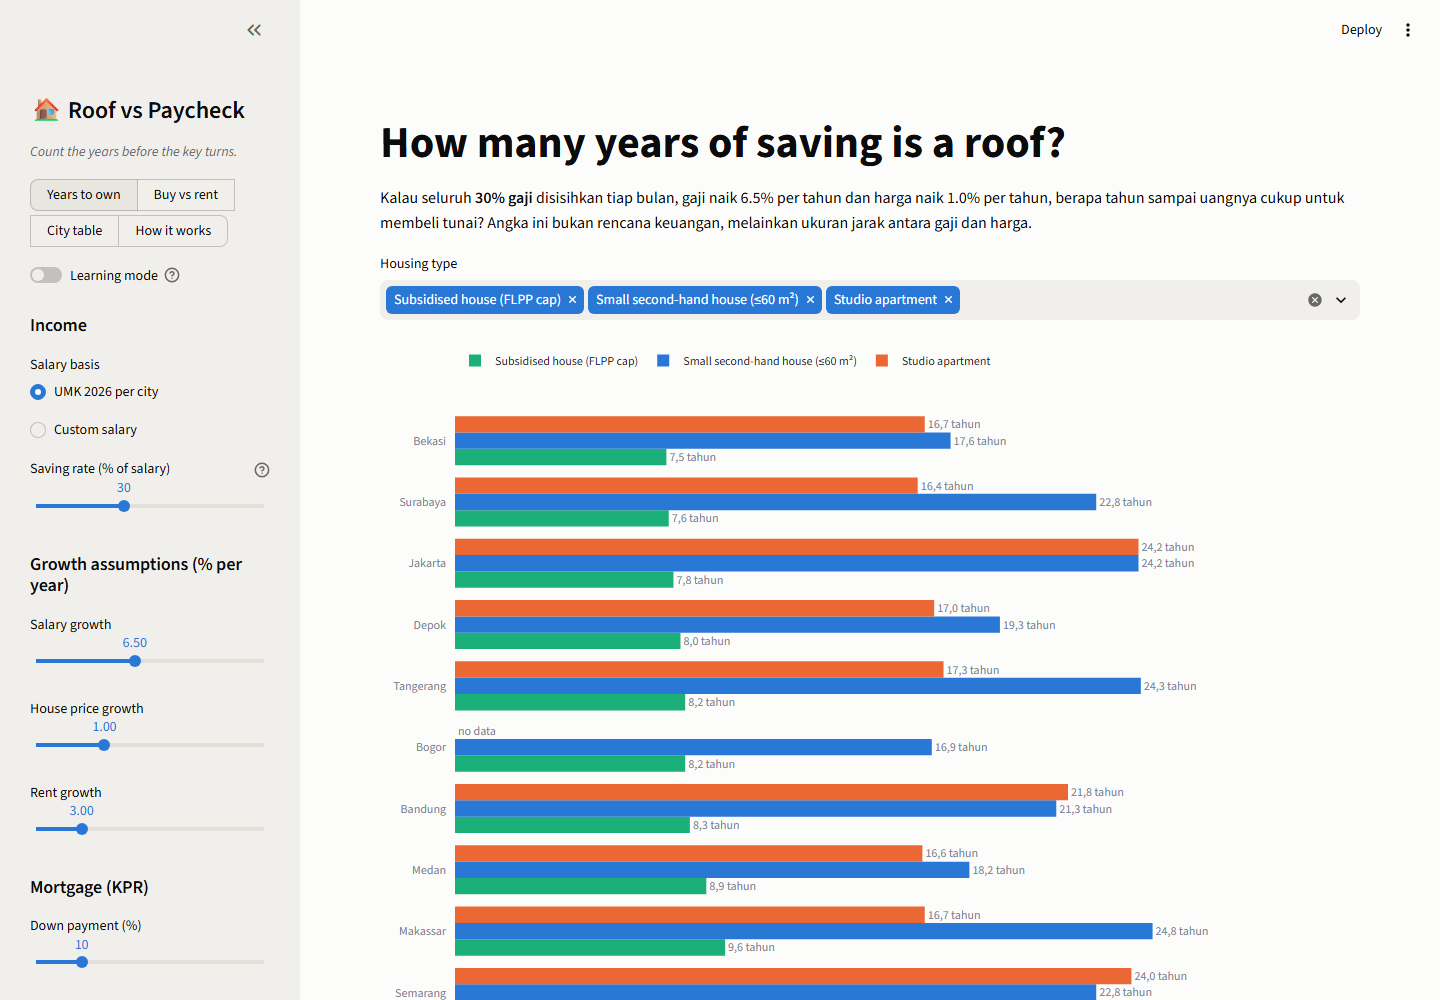
Count the years before the key turns. Puts the 2026 minimum wage of 13 Indonesian cities next to the price of a roof in the same city: subsidised house, second-hand house, studio, boarding room, rented house. Counts the years of saving each one takes, then asks whether a mortgage beats renting once the equity is counted.
|
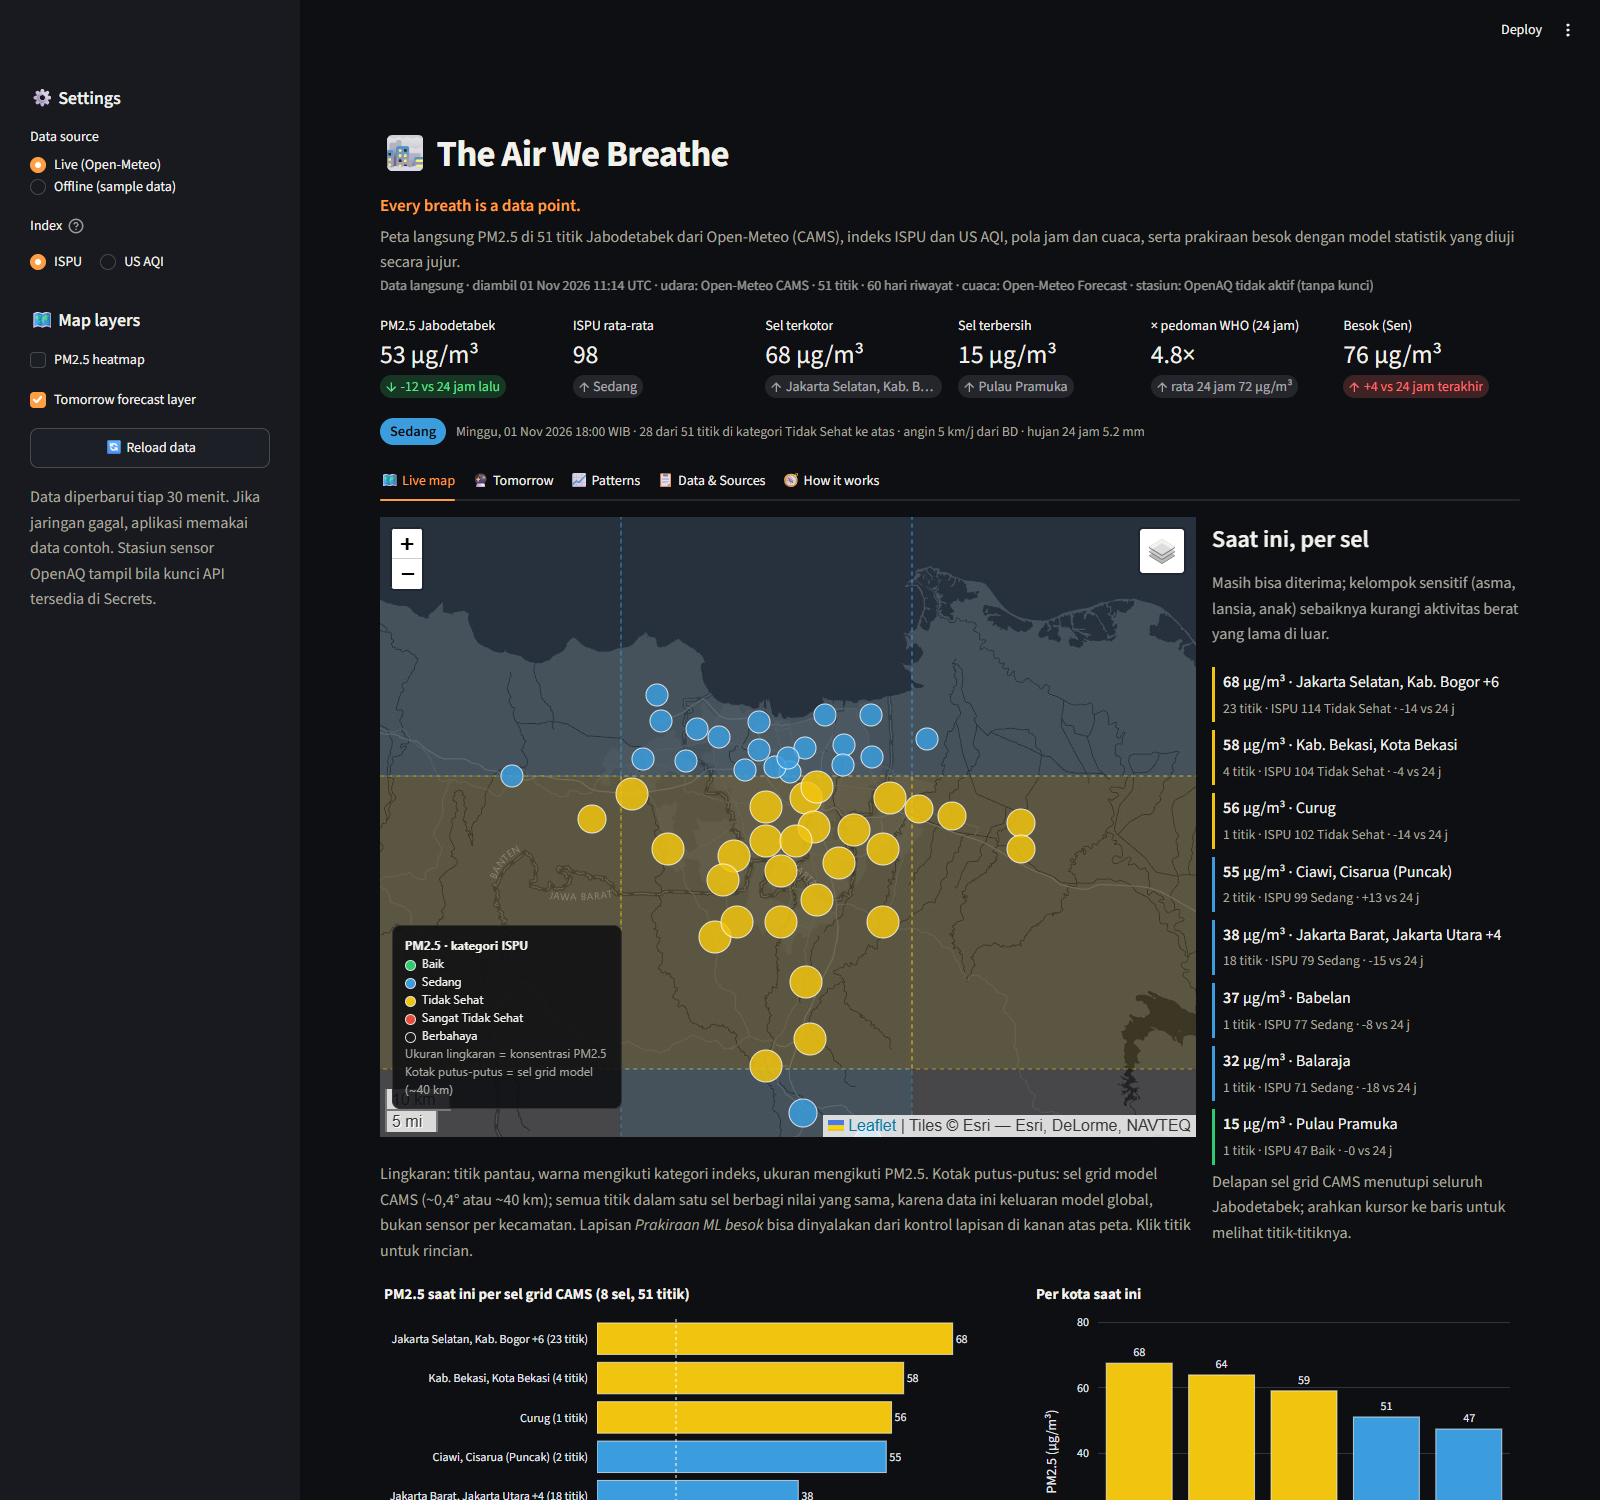
Every breath is a data point. A live PM2.5 map of Greater Jakarta from free Open-Meteo data, scored on Indonesia's ISPU and the US AQI, with hourly and weather patterns and a tomorrow forecast from a small ML model that is backtested against persistence and admits when it loses.
|
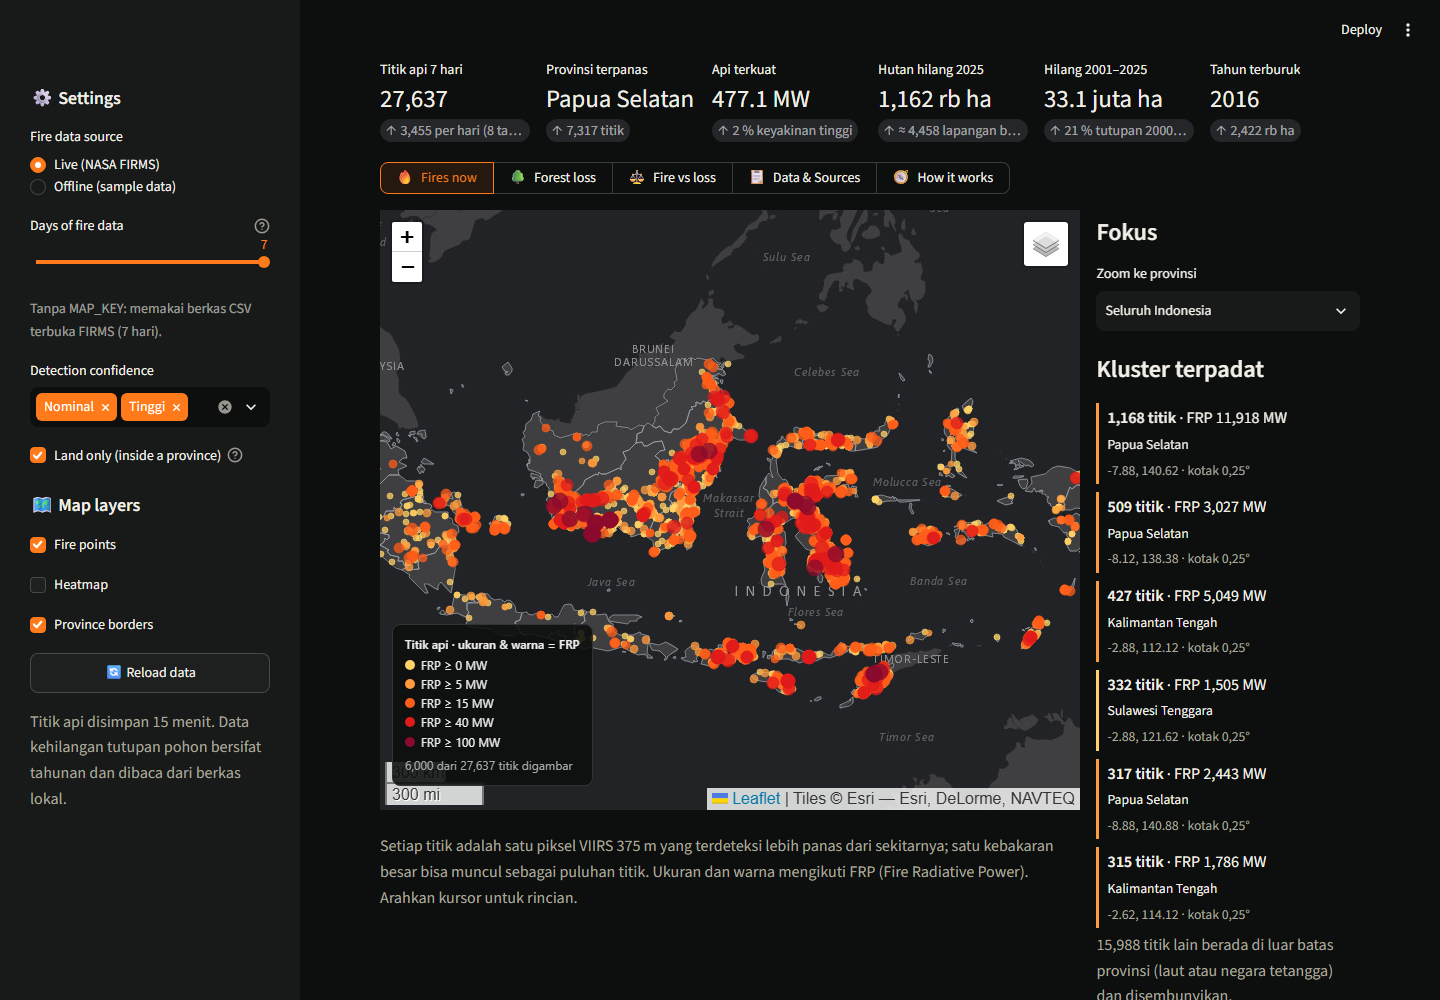
First the smoke, then the silence. A live map of this week's NASA FIRMS fire detections laid over two decades of Global Forest Watch tree cover loss, province by province. Which provinces are burning now, which ones already lost their forest, and how little the two maps overlap.
|
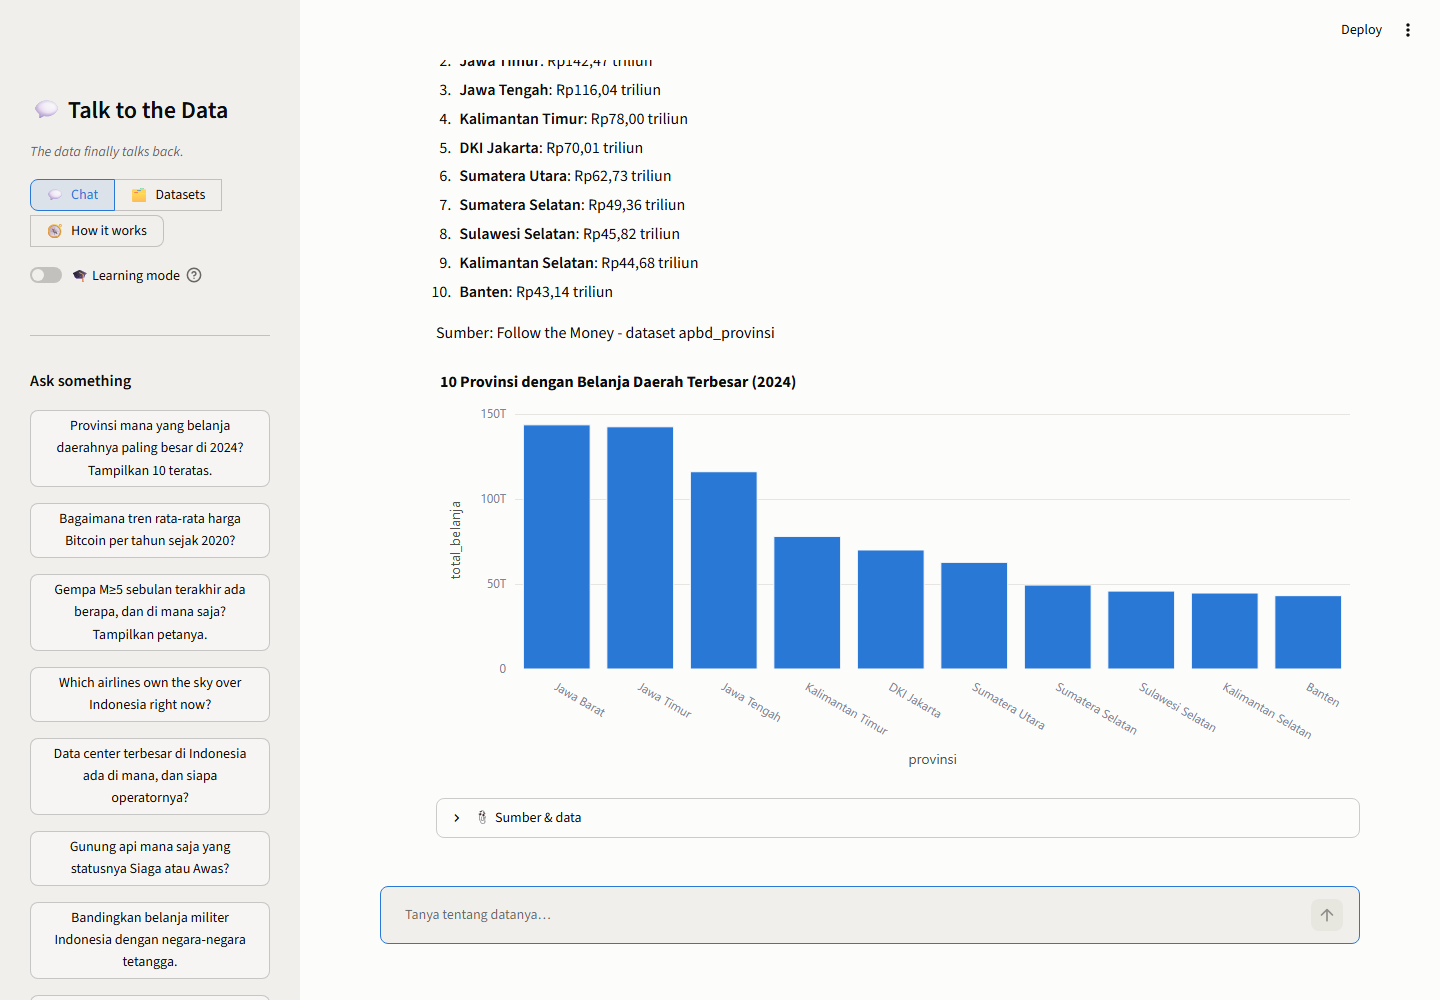
The data finally talks back. One chatbot over every project above. Ask in plain Indonesian or English; a language model turns the question into a structured query, pandas computes the answer, Plotly draws it, and the exact rows it came from ship with every reply. No invented numbers: if the data can't answer, it says so.
|