
Backtest tearsheets that read the book, not just the returns.





▶ Open a live report · The same backtest in QuantStats
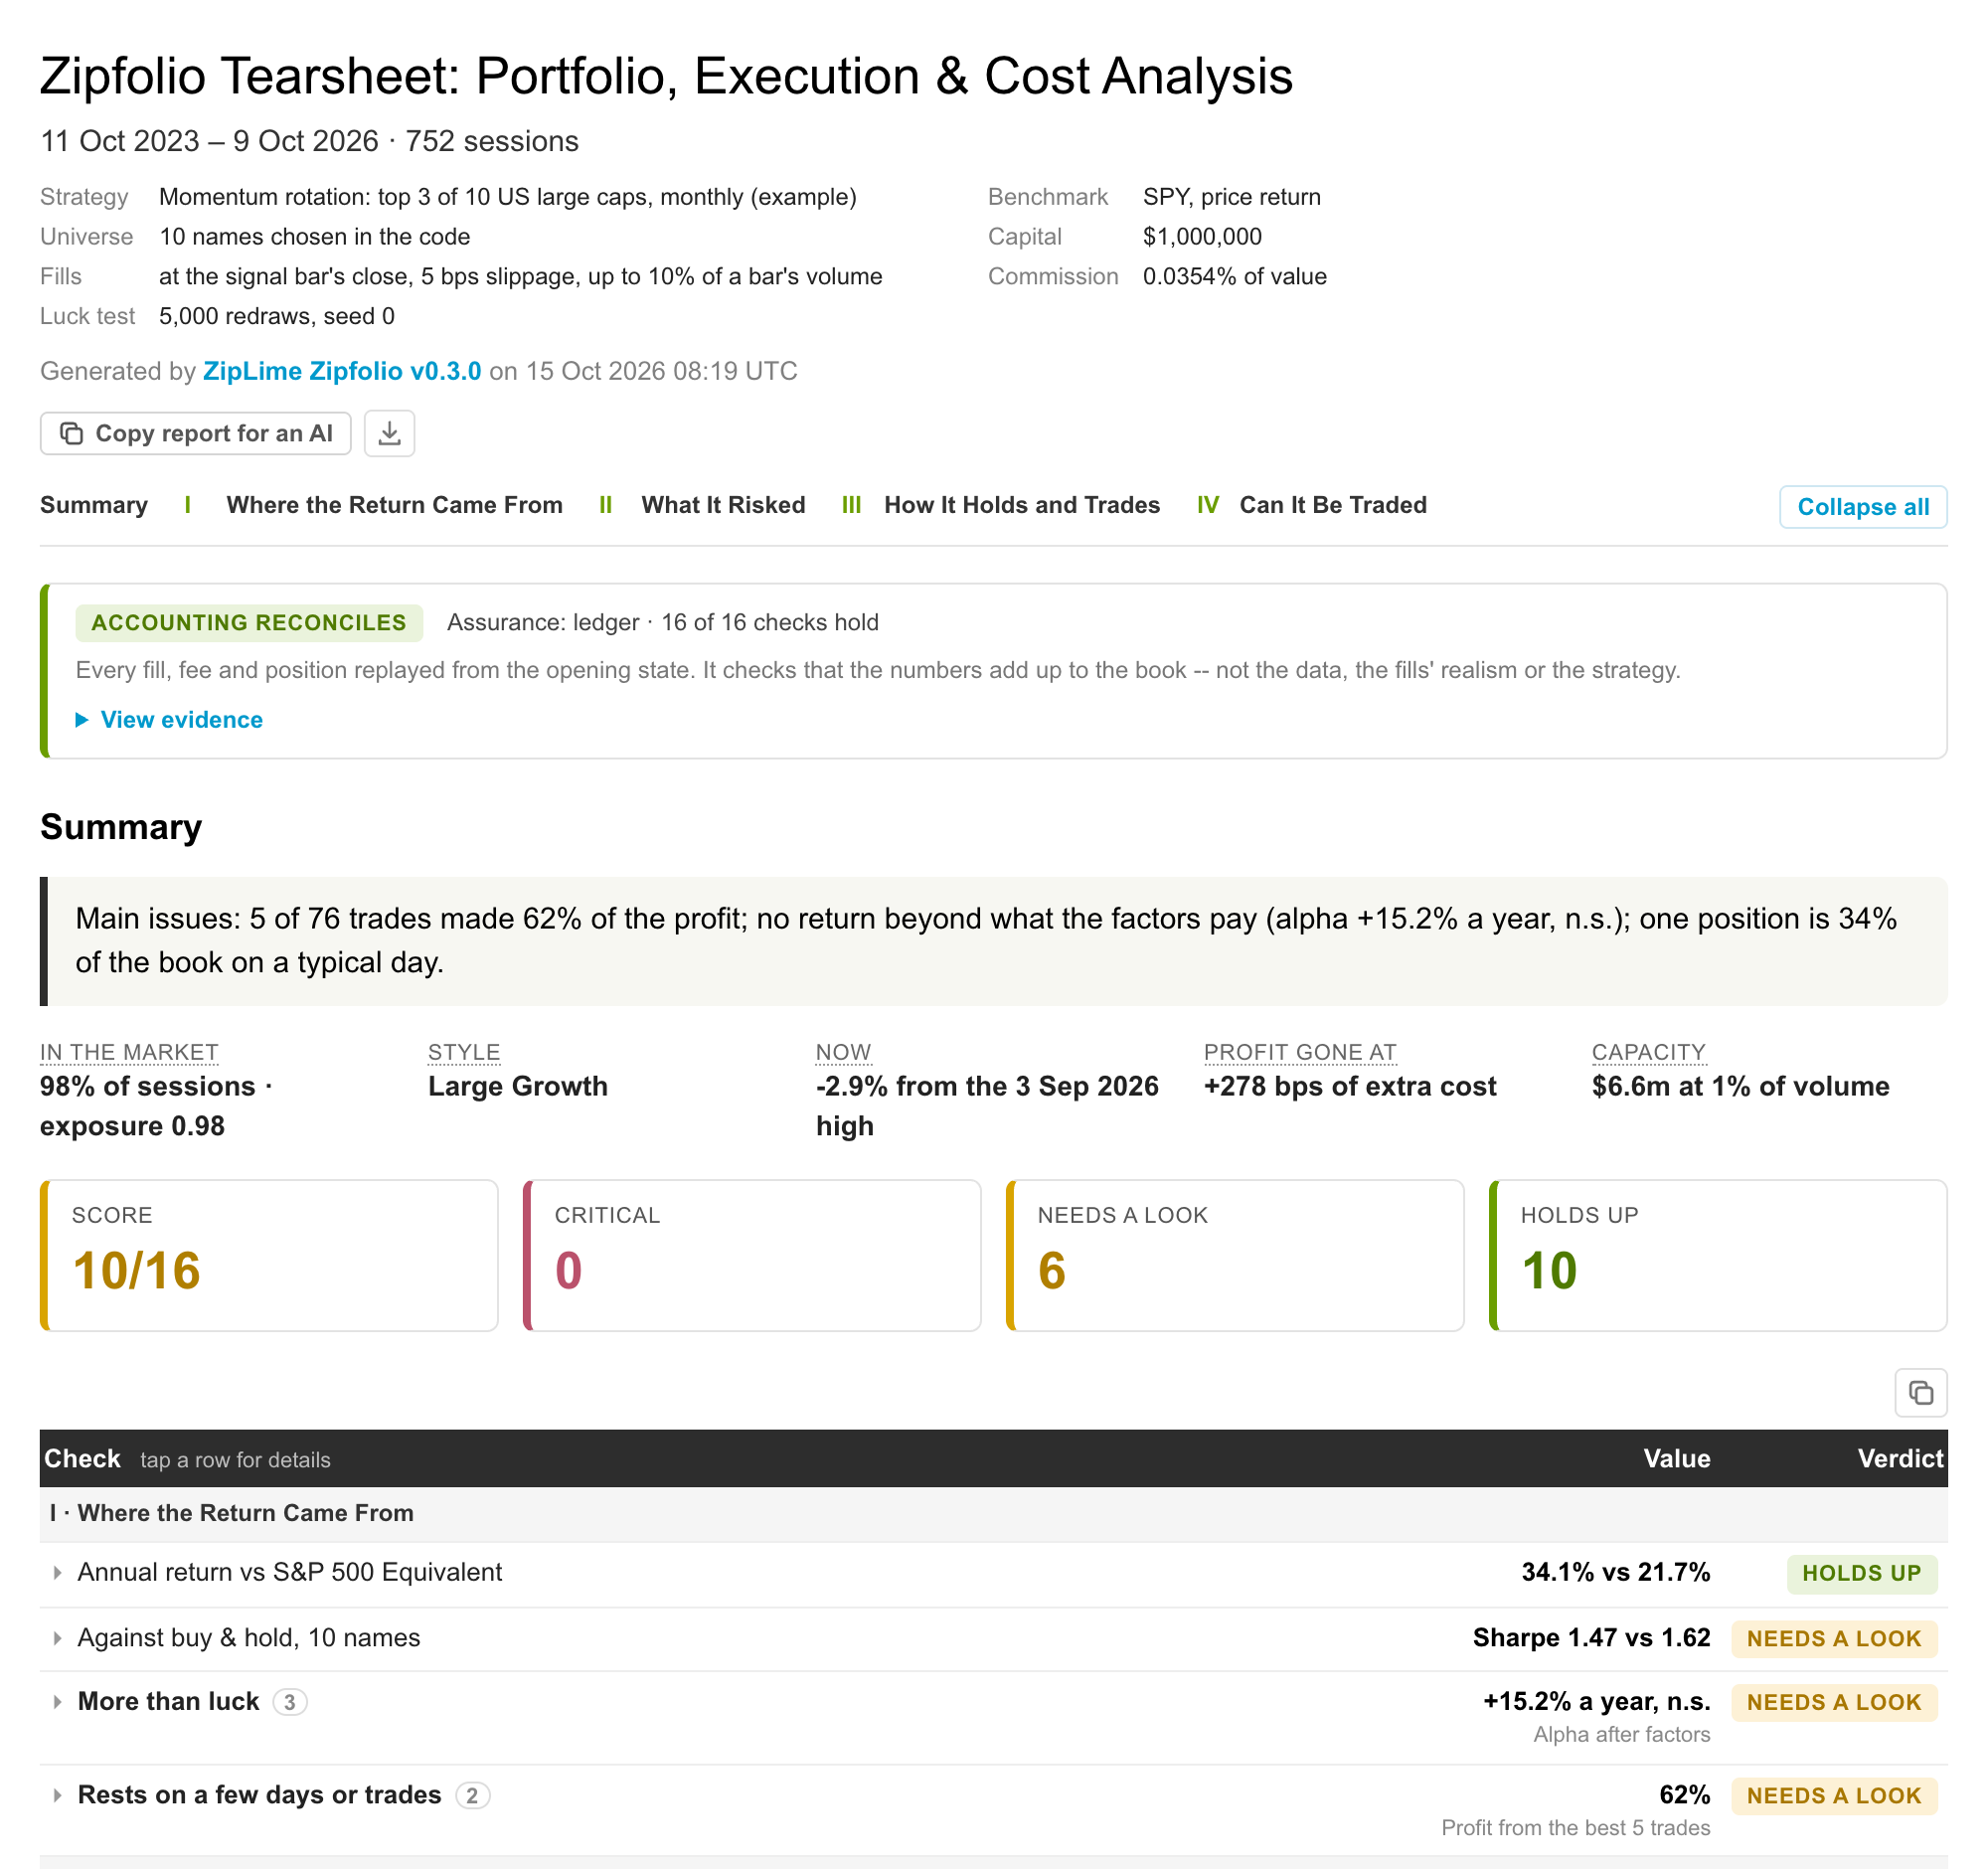
QuantStats tells you what the equity curve did. Zipfolio tells you why it did it, and whether you could have traded it: which positions made the money, which ones made each drawdown, which factors the strategy was really riding, whether its fills were possible at all, and what costs took. It is one self-contained HTML page with interactive charts that also works on a phone, and it checks its own arithmetic before you read it.
pip install -U "zipfolio[all]"import pandas as pd
from zipfolio import build_tearsheet
returns = pd.read_csv("returns.csv", index_col=0, parse_dates=True).squeeze() # one return per day
build_tearsheet("report.html", returns)To see a full report without any data of your own, run the example. It builds a report from a real ziplime backtest (three years, 147 fills) and opens it in your browser:
curl -sO https://raw.githubusercontent.com/Limex-com/zipfolio/main/examples/quickstart.py
python quickstart.pyOnly returns is required. Each input you add turns on the sections that need it:
| Add | And the report gains | Sections |
|---|---|---|
returns |
key metrics, the return without its best days, Fama-French exposures and a style box, tail risk | 4 |
benchmark |
up and down capture, market regimes, the security market line and CAPM measures | 6 |
position_records, cash, transactions |
PnL by instrument, drawdowns split by name, risk by holding, positions, turnover, closed trades, trading costs | 13 |
sector_mappings |
a treemap of where the capital went, allocation and PnL by sector | 14 |
orders |
execution: fill realism, order types, waits, implementation shortfall | 15 |
fill_bars, market_data |
every fill repriced at the next bar's open, capacity, the efficient frontier | 17 |
build_tearsheet(
    "report.html", returns, benchmark,
    position_records=positions,   # date, symbol, quantity, last_sale_price: one row per open position per day
    cash=cash,                    # cash at the end of each day
    transactions=fills,           # dt, symbol, quantity, price: one row per fill
    sector_mappings={"AAPL": "Information Technology", "JPM": "Financials"},
)
The frames are plain pandas, so any backtester that can export positions and fills gets the same
report. For a ziplime run, zipfolio.ziplime reads the rest out of
its market-data bundle: see Zipfolio and ziplime.
QuantStats sees one number per day. A drawdown, a Sharpe ratio or a monthly heatmap can be computed from that. Nothing in that number says whether a fill was possible, what slippage cost, or which position carried the risk. Zipfolio reads the book the returns came from:
| QuantStats | Zipfolio | |
|---|---|---|
| Input | daily returns and a benchmark | returns and the book: positions, fills, orders, bars, the cost model |
| Interactive charts: hover, zoom, hide a series, full screen, PNG / SVG export | static images | ✅ |
| Layout that adapts to a phone | fixed 960 px | ✅ |
| A one-line verdict and a 16-check scorecard | — | ✅ |
| An accounting check: the book replayed, 16 invariants | — | ✅ |
| Sharpe, Sortino, drawdowns, key metrics | ✅ | ✅ |
| Is it luck? | probabilistic Sharpe | probabilistic and deflated Sharpe, trade bootstrap, the return without the best days |
| Alpha and beta | against the benchmark | Fama-French 5 + momentum with t-stats, style box, rolling betas |
| What each instrument and sector earned | — | ✅ |
| Which names made each drawdown | — | ✅ |
| Risk by holding, predicted against realised | — | ✅ |
| Security market line, efficient frontier | — | ✅ |
| Were the fills possible? Price inside the bar, share of its volume | — | ✅ |
| The same trades filled a bar later | — | ✅ |
| Commission and slippage, reconstructed and stress-tested | — | ✅ |
| Capacity | — | ✅ |
| Closed trades: win rate, profit factor, holding time | — | ✅ |
| Rolling Sharpe and Sortino, monthly returns heatmap, the strategy's return histogram | ✅ | — |
The last row is deliberate. Zipfolio covers what a return series cannot show and leaves return analytics to QuantStats. ZipLime builds both reports for every backtest. To compare them, open the same backtest in QuantStats and in Zipfolio.
These panels come from the US momentum example. It rotates monthly into the top 3 of 10 US large caps, with $1m, from October 2023 to October 2026.
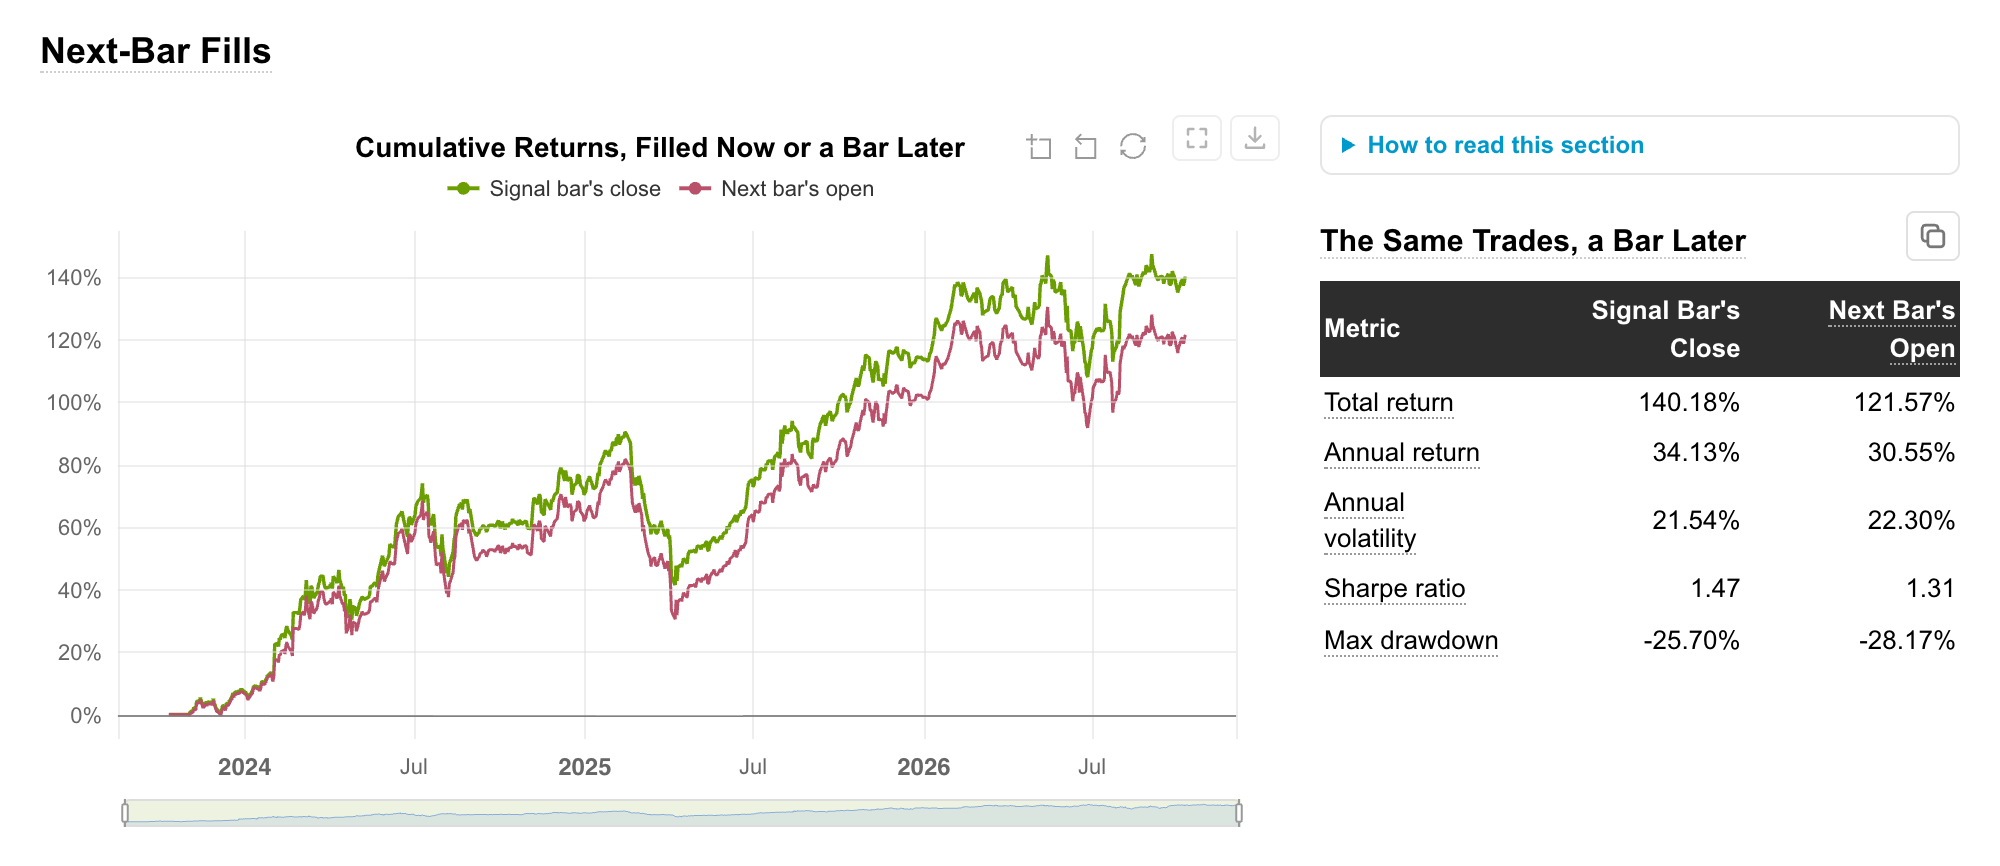
Could it have been traded? The backtest fills each order at the close of the bar that produced the signal. Zipfolio fills the same 147 trades at the next bar's open instead. The total return falls from 140% to 122% and the Sharpe ratio from 1.47 to 1.31: waiting one bar costs $186k. QuantStats never sees a fill, so it cannot run this check.
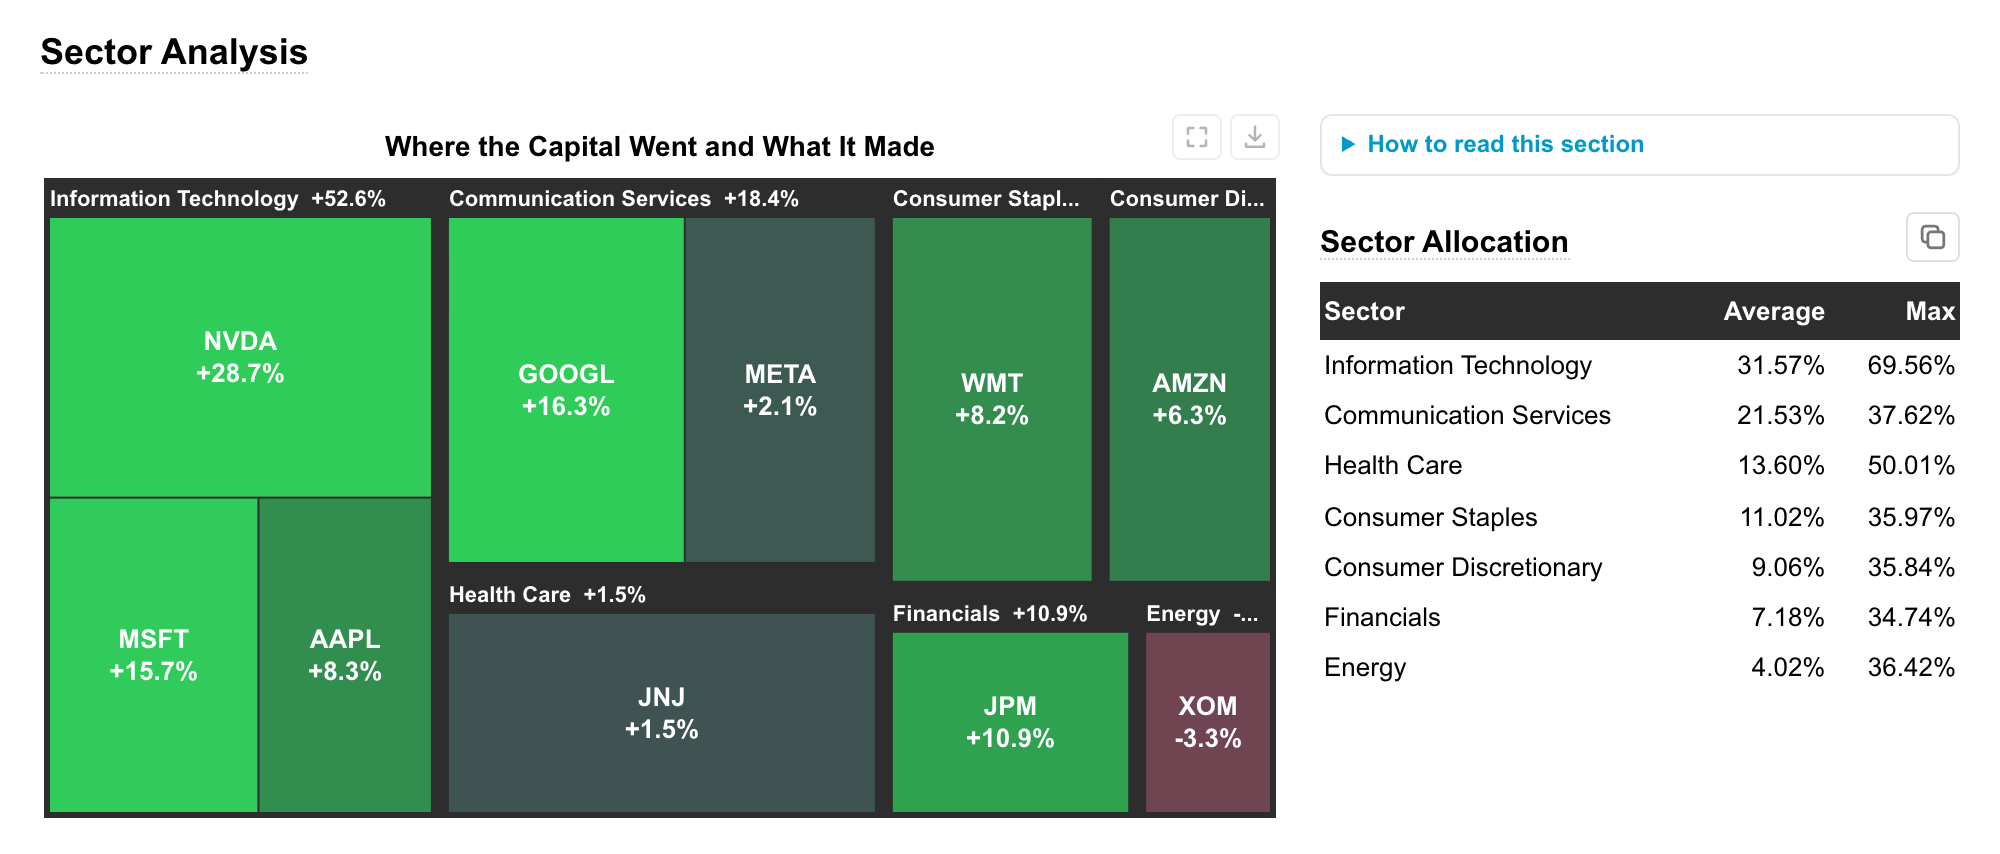
Where did the capital go, and what did it make? In the treemap, each tile is one name inside its sector, sized by the capital it took and coloured by what it added to the return.
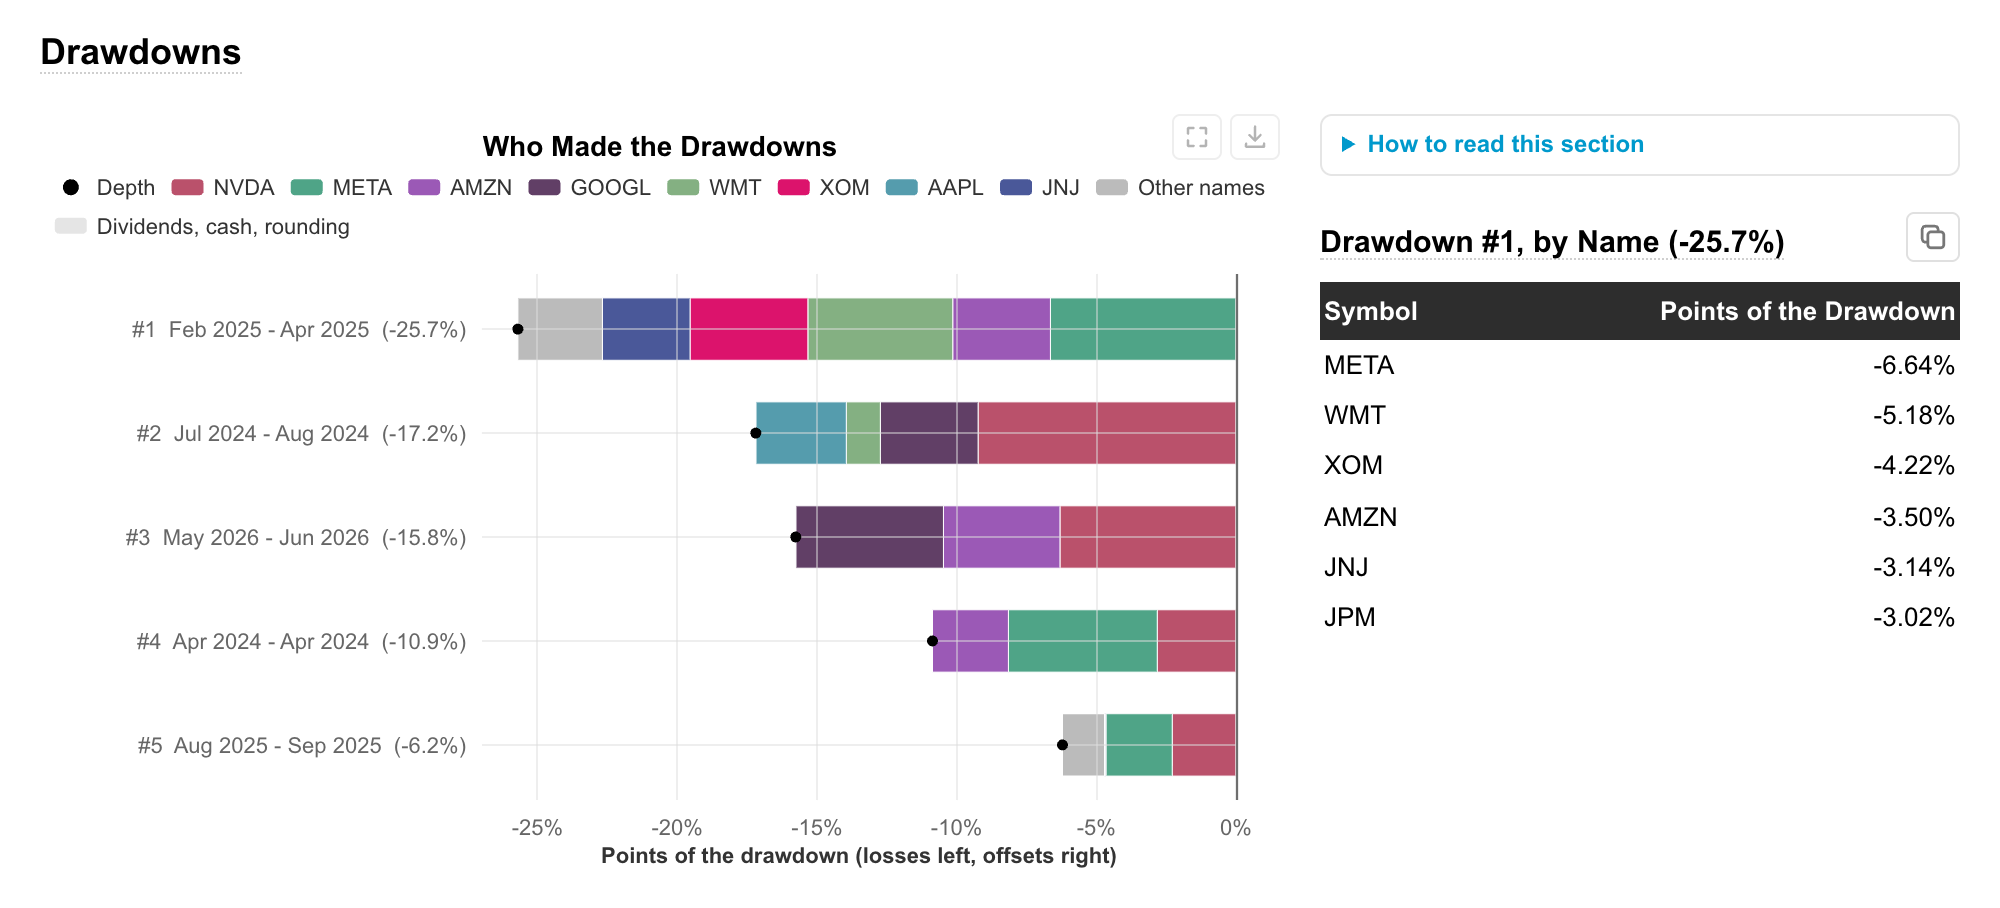
Who made each drawdown? Each of the five worst drawdowns is split across the names that made it. The split is exact, to the percentage point.
What is it really exposed to? The style box places the strategy by its Fama-French betas and traces its rolling path. The efficient frontier of the names it held shows what a fixed mix would have done. The frontier uses hindsight, so the page labels it as a ceiling.
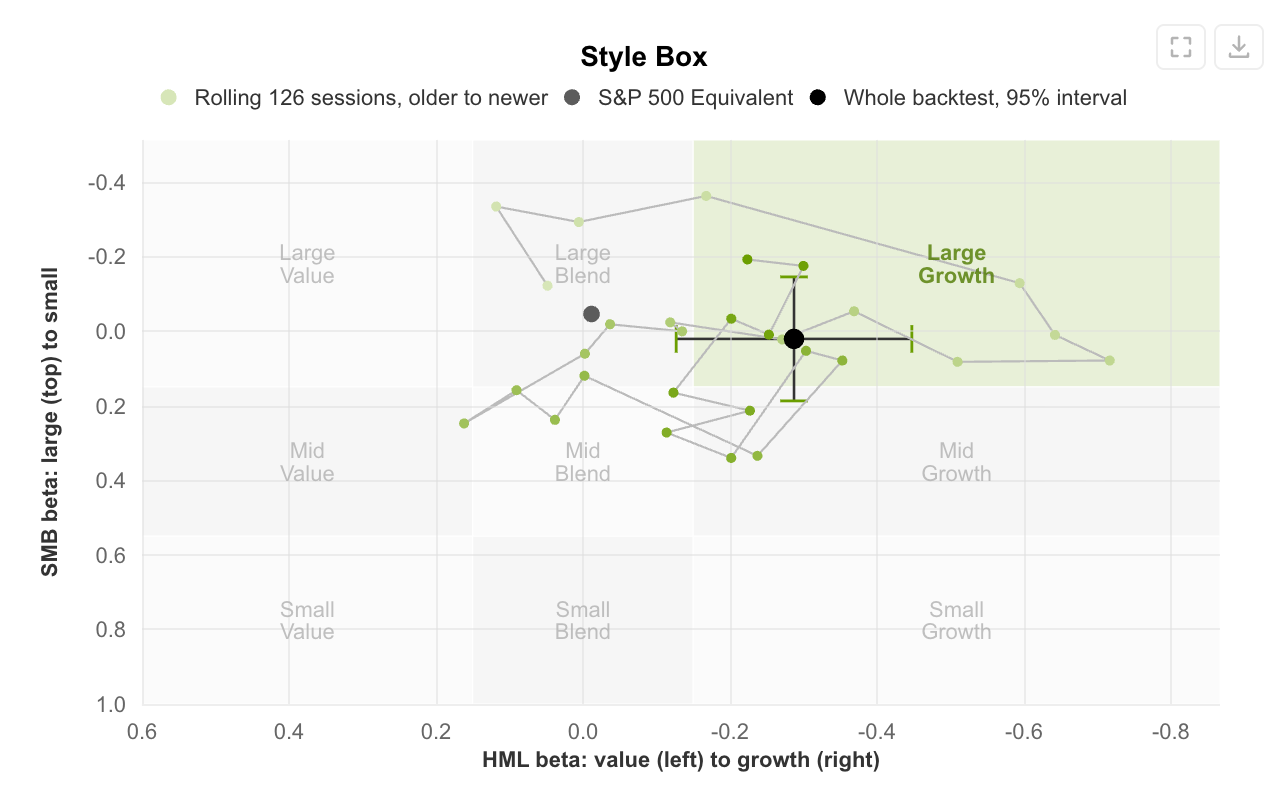
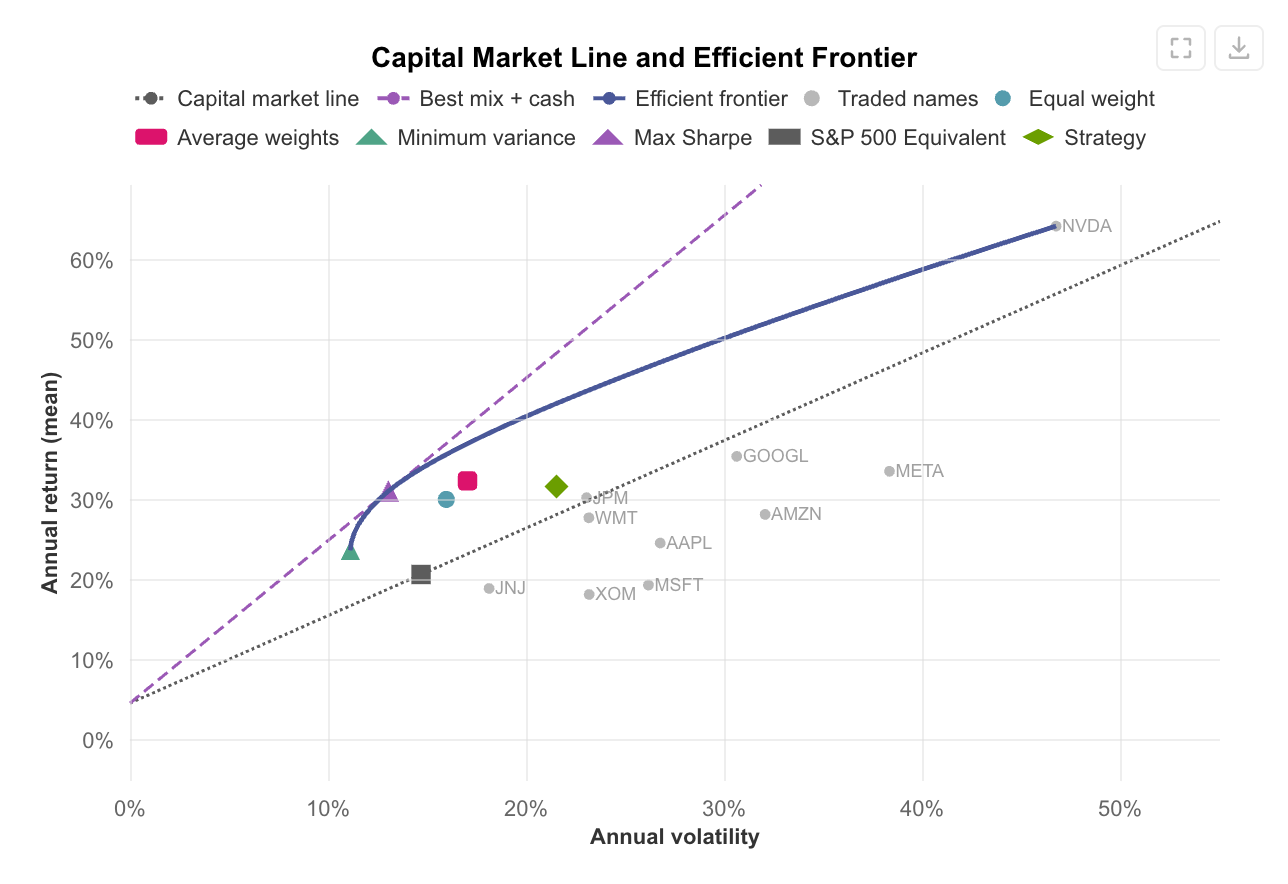
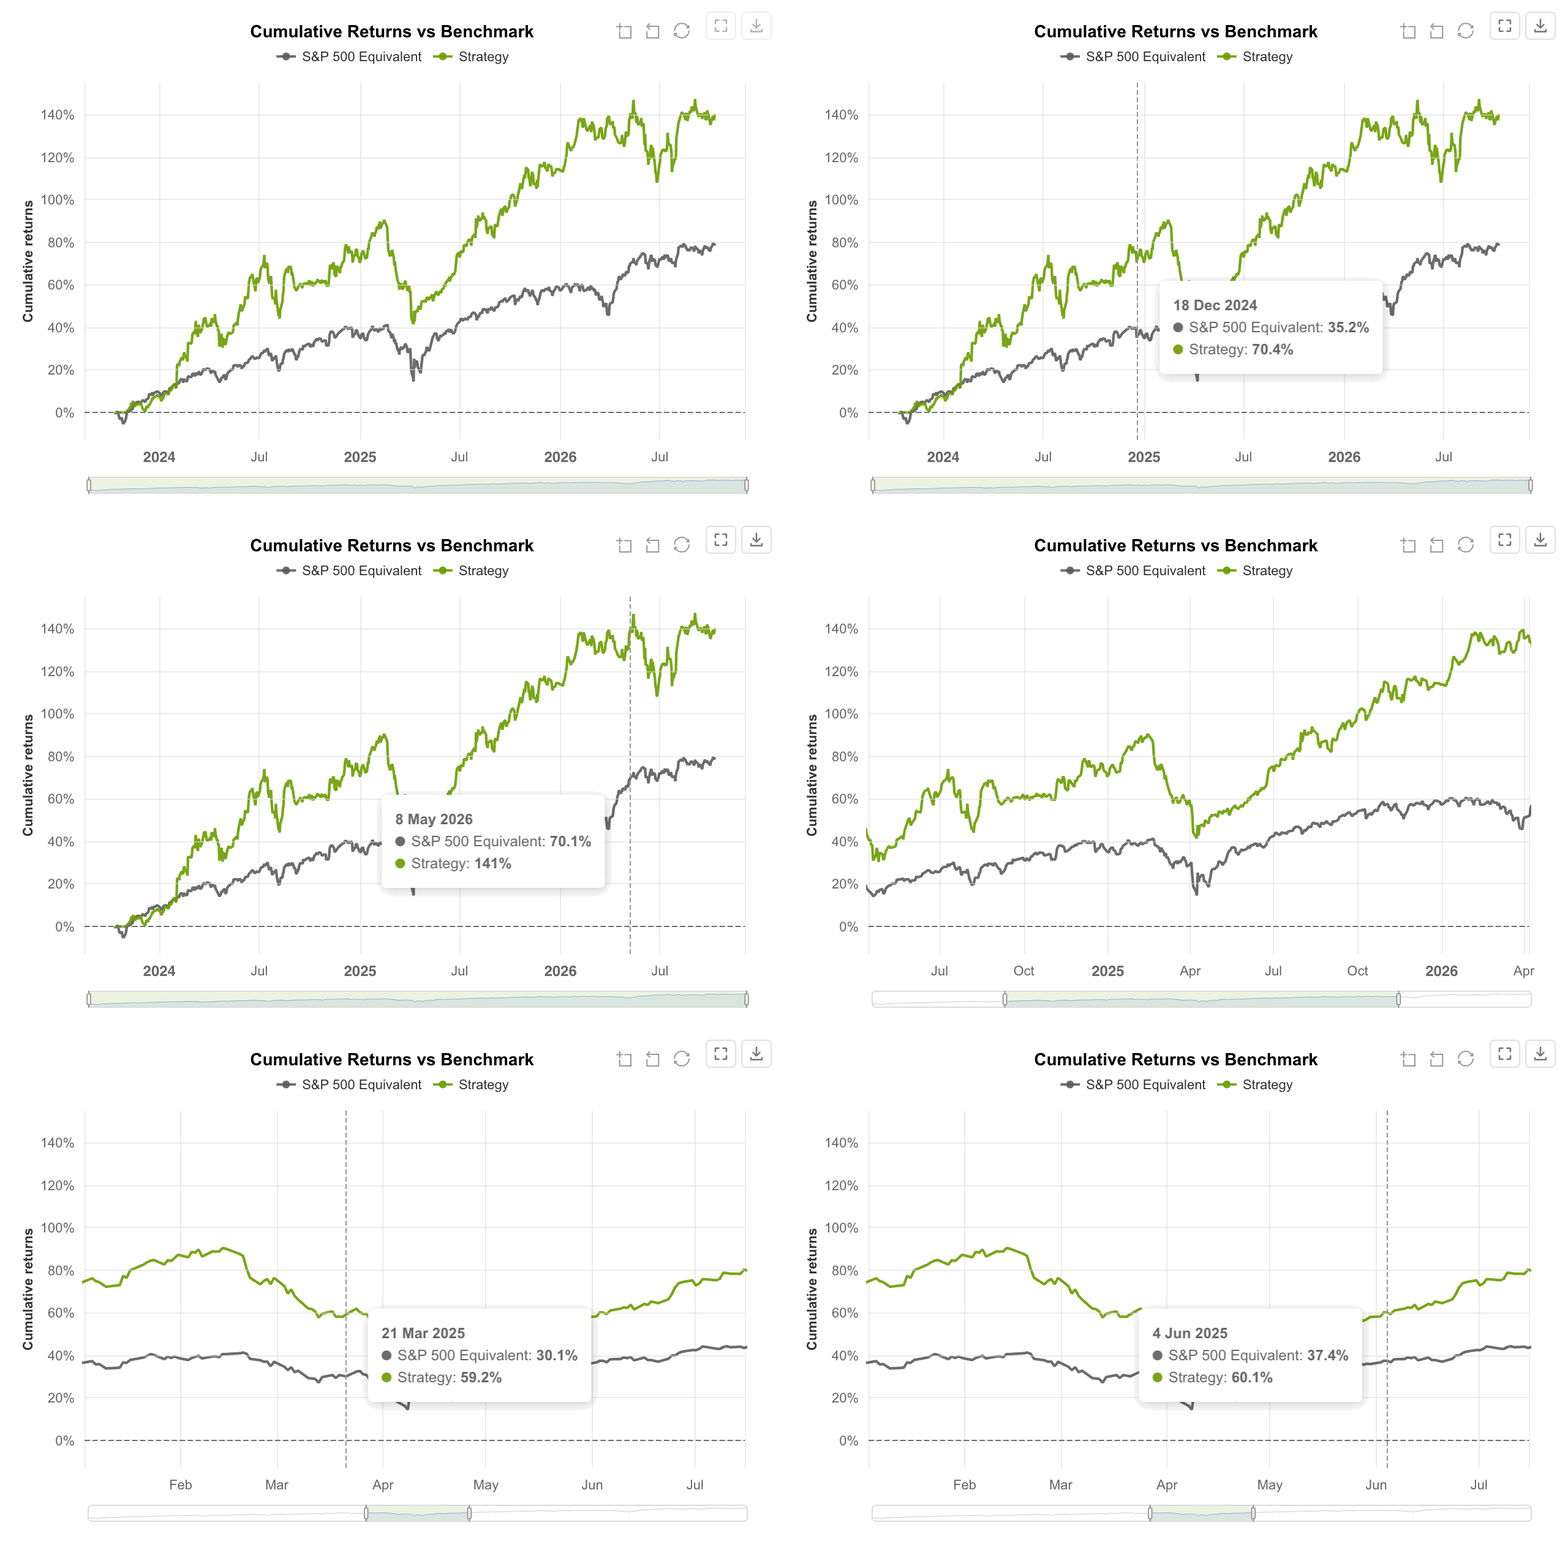
Every chart is live. Hover a chart to read the values, click a legend entry to hide a series, and
zoom with the slider. Any chart opens full screen and saves as PNG, JPG or SVG. Each table has a
copy button for Excel or Google Sheets. A term such as CVaR, Treynor or M² explains itself on hover.
Copy report for an AI puts the page's numbers on the clipboard as Markdown, so you can discuss
the strategy with any assistant. The page loads nothing from the network: ECharts is inlined, and
interactive=False gives static SVG instead.
On a phone, each chart redraws for the width it gets, and the scorecard turns into cards.
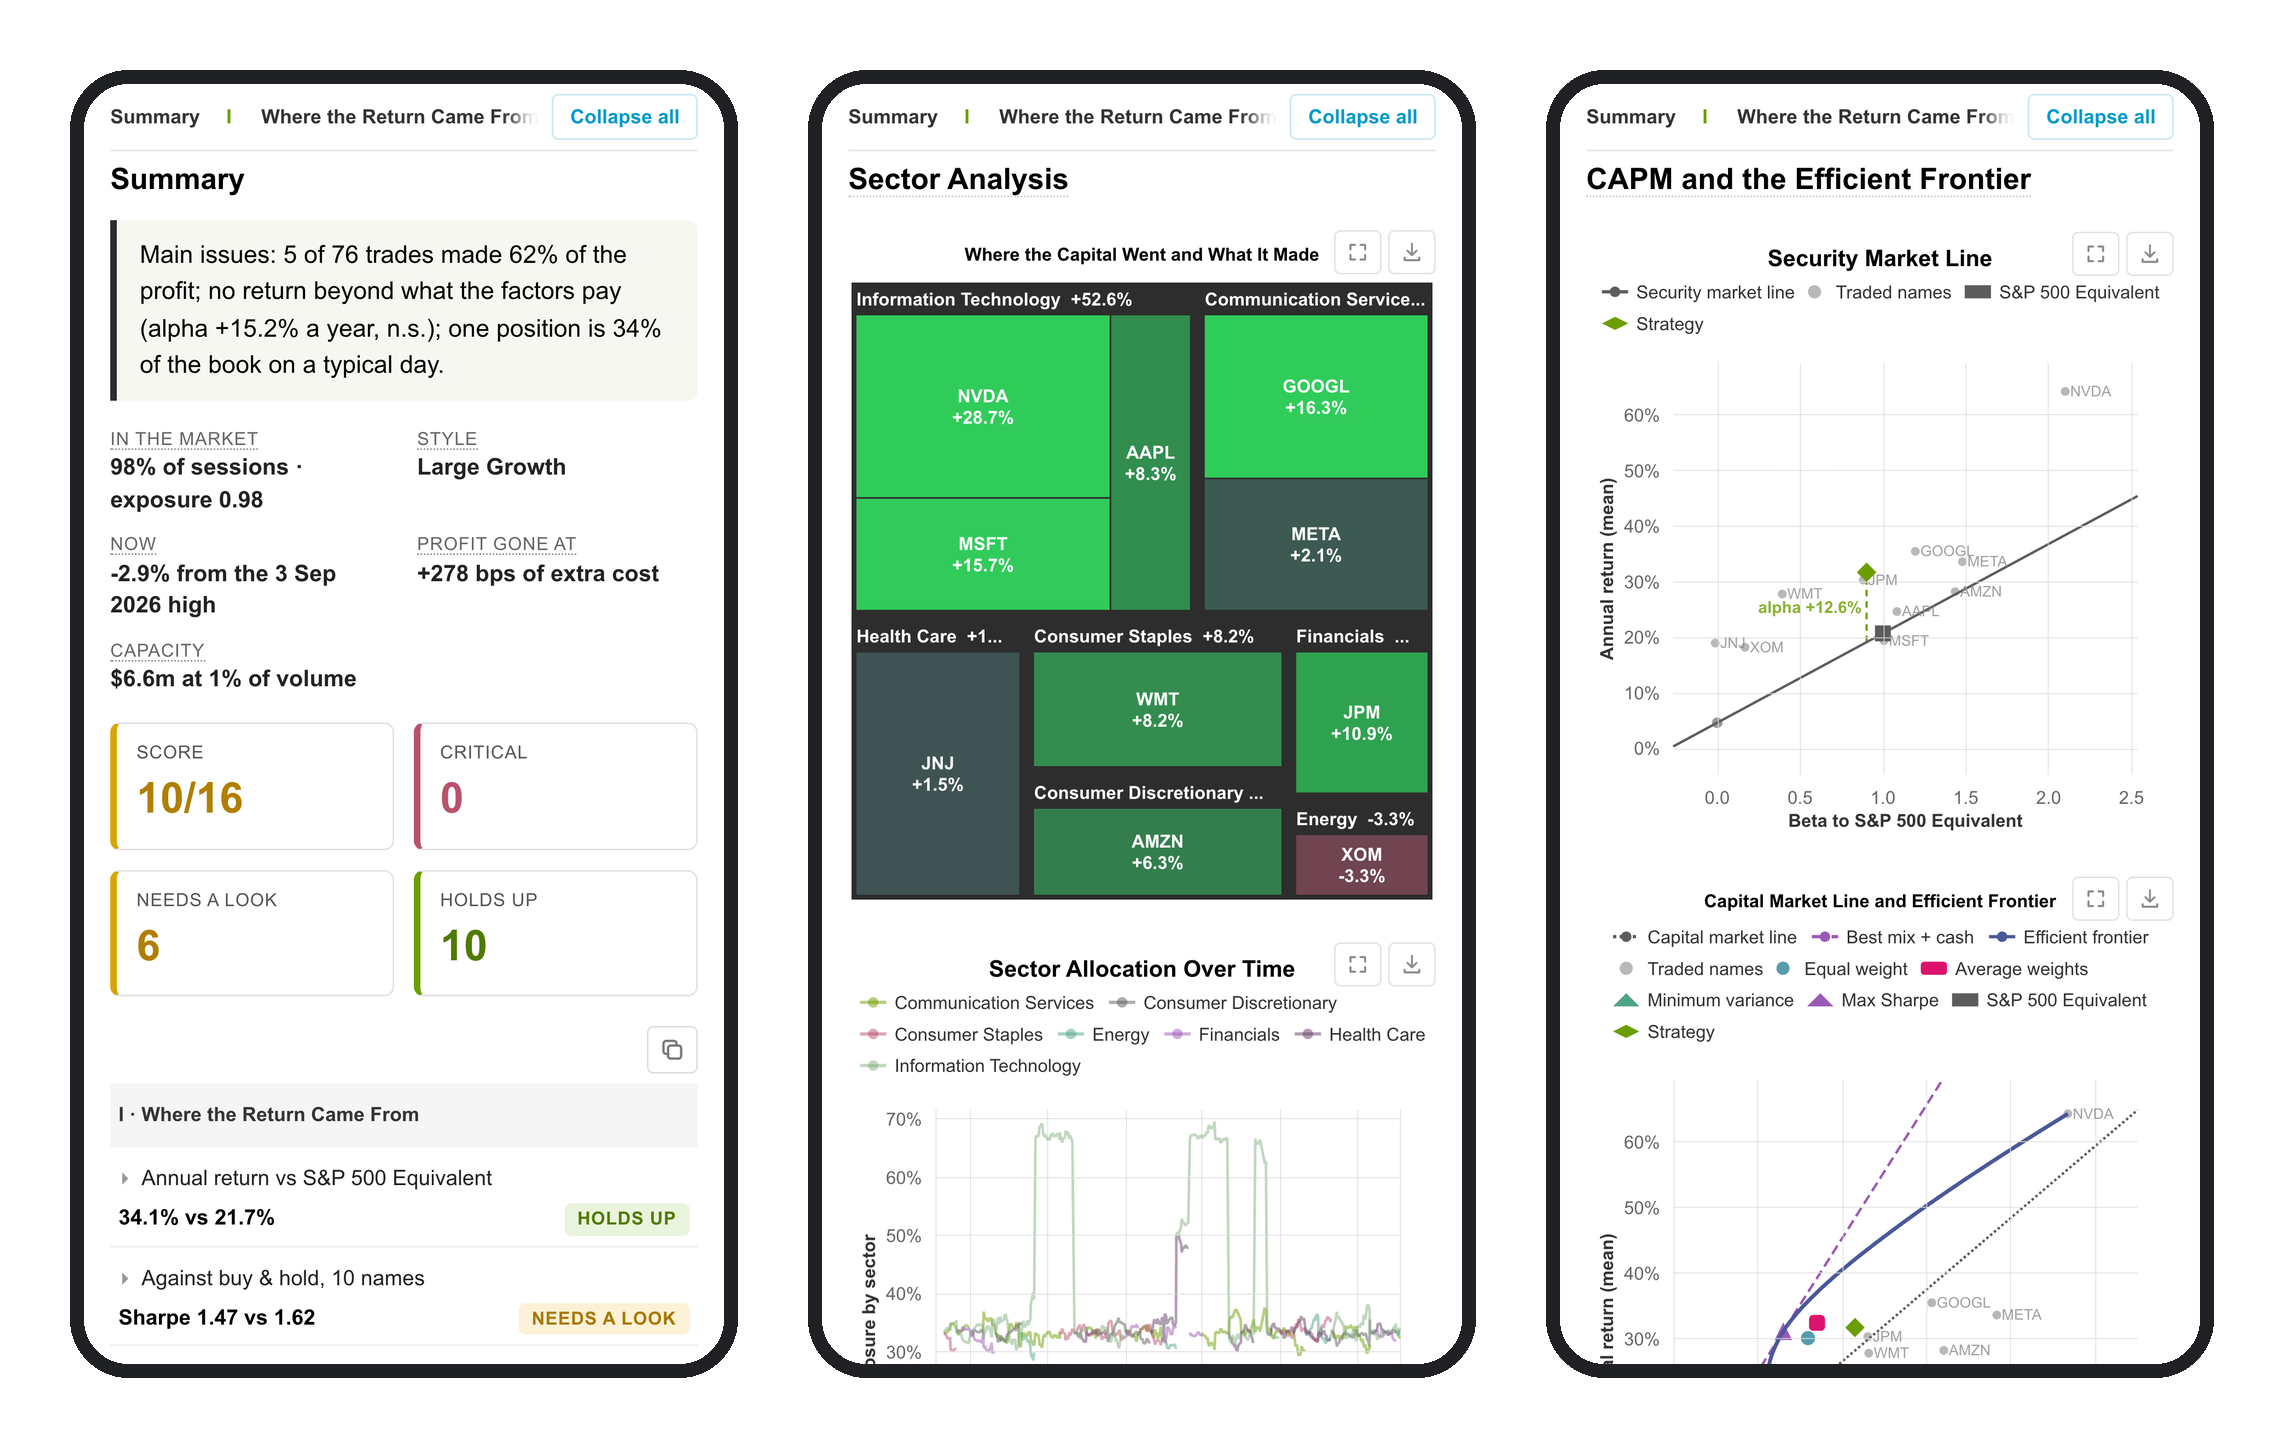
The summary comes first: the main issues in one sentence, the facts at a glance, a score and 16 checks, four per part. The checks are the same for every backtest. Open a check to see its reasoning, its threshold and what to try. The sections follow in four parts, each answering one question:
| Part | Sections |
|---|---|
| I. Where the return came from | Performance · Profit Concentration · Instruments · Long and Short · Sector Analysis · Factor Analysis |
| II. What it risked | Drawdowns · Market Regimes · Portfolio Risk · CAPM and the Efficient Frontier · Risk Over Time |
| III. How it holds and trades | Positions · Transactions · Closed Trades |
| IV. Can it be traded | Next-Bar Fills · Execution · Trading Costs · Capacity |
A section that cannot be computed becomes a short note. The page fails only if it can report nothing at all. The reference lists what each section contains and when it appears.
The numbers are checked before you read them. zipfolio.integrity replays the book from the
opening state, independently of the report: every fill, fee, cash movement and position. It then
checks every profit figure the page publishes against that replay. The panel at the top of the page
shows the result, and the same check runs from a shell or in CI:
# book.pkl: a pickle of AccountingInputs fields
python -m zipfolio.integrity book.pkl --mode ci --json accounting_integrity.jsonUS stocks get Fama-French factors by default. For any other market, use a market model against your own benchmark and risk-free rate:
| US stocks (default) | Any other market | |
|---|---|---|
| Factors | Fama-French 5 + momentum | factor_model="market": alpha and beta against your benchmark |
| Risk-free rate | one-month T-bill (Fama-French RF) |
risk_free=: your rate as a series, in percent a year |
| Sectors | GICS, from a table you supply | any {symbol: sector} |
| Currency | currency="USD" |
"EUR", "GBP", "JPY", "CHF"... any of 24 ISO codes |
| Clock for fill times | New York | market_timezone=, the venue's own |
build_tearsheet("report.html", returns, dax.rename("DAX"), ...,
                factor_model="market", risk_free=estr.rename("€STR"),
                currency="EUR", market_timezone="Europe/Berlin",
sector_mappings={"SAP": "Information Technology", "ALV": "Financials"})All inputs are plain pandas. Only returns is required.
| Argument | Shape | Used by |
|---|---|---|
returns |
per-period strategy returns, datetime index | everything |
benchmark |
benchmark returns, same index, or None |
Performance, Market Regimes, Portfolio Risk, CAPM |
position_records |
rows of date, symbol, quantity, last_sale_price per open position per day |
Positions, Instruments, Sectors, Risk, Closed Trades |
cash |
cash at the end of each period | (same) |
transactions |
rows of id, order_id, dt, symbol, quantity, price |
Instruments, Transactions, Execution, Costs, Closed Trades |
orders |
rows of id, created, dt, type, symbol, quantity, filled, commission, limit, stop, status, reason |
Execution, Trading Costs, Instruments |
fill_bars |
open, high, low, close, volume, optionally next_open, next_date, indexed by fill id |
Execution, Next-Bar Fills |
decision_prices |
decision_price indexed by order id |
Execution (shortfall) |
market_data |
rows of symbol, day, price, volume |
Capacity, Portfolio Risk, Efficient Frontier |
cost_settings |
commission_model, commission_per_share, commission_rate, commission_min_trade_cost, slippage_basis_points, slippage_volume_limit, price_used_in_order_execution, same_bar_execution, capital |
Trading Costs, Execution |
sector_mappings |
{symbol: sector}, or us_sector_mappings([...], table=...) for GICS from your own table |
Sector Analysis |
factor_model |
"ff5_mom" (default), "ff5", "ff3", "ff3_mom", "market" or None |
Factor Analysis |
risk_free |
for "market": the risk-free rate as a series in percent a year. Default None: nothing is downloaded, the model runs on raw returns and the report says so |
Factor Analysis |
currency |
an ISO code: "USD" (default), "EUR", "GBP", "JPY", "CHF", "CAD"... 24 in zipfolio.CURRENCIES |
how every amount is written: €1,234.56, ¥1,235, CHF 1,234.56 |
trials |
how many versions of the strategy were tried: the Sharpe ratio is then deflated for them | Performance |
run_info |
{label: value} for the header: strategy, benchmark, universe |
header |
interactive |
True (default) or False for static SVG |
every chart |
opening_state, contract_specs, portfolio_events |
the book before the first session, what each instrument is, dividends, fees, flows, splits | Accounting integrity |
title, market_timezone, factor_data, integrity, integrity_report, integrity_policy |
see the reference |
build_tearsheet returns the titles of the sections that made it into the page, in page order.
pip install zipfolio              # the core report
pip install "zipfolio[risk]"      # + skfolio: Portfolio Risk and the efficient frontier
pip install "zipfolio[ziplime]"   # + polars: zipfolio.ziplime, the bundle readers
pip install "zipfolio[all]"       # everything
Python 3.10+. Without skfolio the Portfolio Risk section and the efficient frontier are left out, and
nothing else changes. To install the latest unreleased code:
pip install "zipfolio[all] @ git+https://github.com/Limex-com/zipfolio".
Network: the page itself makes no requests. The library downloads Fama-French factors from Kenneth
French's data library and caches them for a week. If the download fails, the library falls back to
the cache, and failing that the report shows a note. GICS sectors are not shipped, because MSCI
and S&P license the classification: bring your own table, or pass any {symbol: sector}. Details
are in Data the package fetches or ships.
- Futures exposure is understated: positions are valued at quantity × price, with no contract multiplier.
- Slippage is reconstructed for the fixed-basis-point model only.
- Factor analysis needs at least 60 sessions inside the factor data, which is published monthly with a lag.
- The efficient frontier uses the returns the names went on to make. It is hindsight and long only.
- The reference: every section and check, the accounting integrity check, how Zipfolio uses pyfolio, the ziplime integration, the release process.
- CHANGELOG.md
- Development:
pip install -e ".[all]" pytest && pytest. The tests never touch the network.
Apache License 2.0. See LICENSE. Zipfolio builds on pyfolio-reloaded (Apache-2.0), skfolio (BSD-3-Clause) and Apache ECharts (Apache-2.0, inlined in every page). No market or classification data ships with it. Zipfolio is part of the ZipLime ecosystem.