
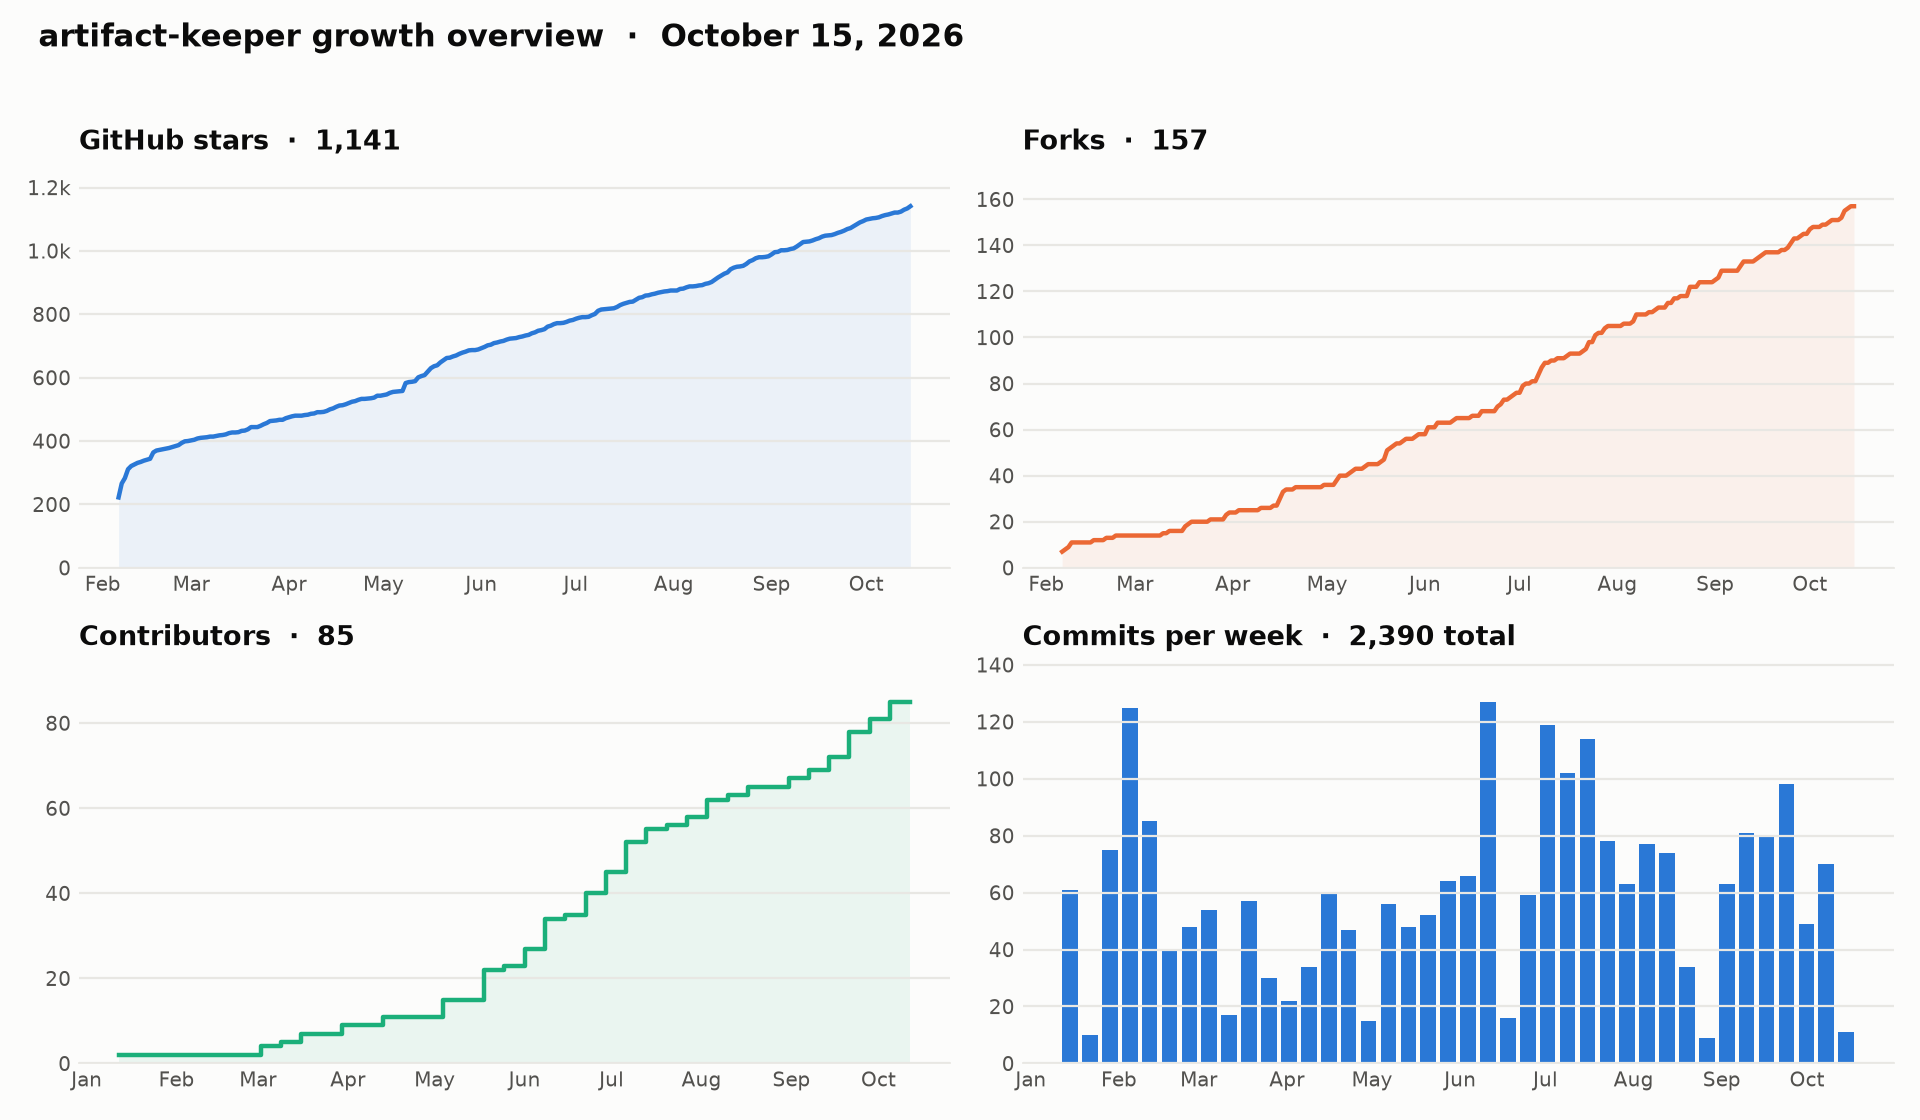
Adoption and community metrics for Artifact Keeper open-source projects, collected daily by a GitHub Actions workflow and committed back to this repo. Charts and numbers below regenerate on every run.
Last updated: 2026-10-15 11:38 UTC
Data lives in data/ as plain CSV so it can be dropped into a spreadsheet or deck.
Chart images are in charts/ as PNG and SVG. Machine-readable latest numbers are in
latest.json, and badges/ holds shields.io endpoint badges for metrics
shields cannot compute on its own.
Repository: artifact-keeper/artifact-keeper
| Metric | Now | 30-day change |
|---|---|---|
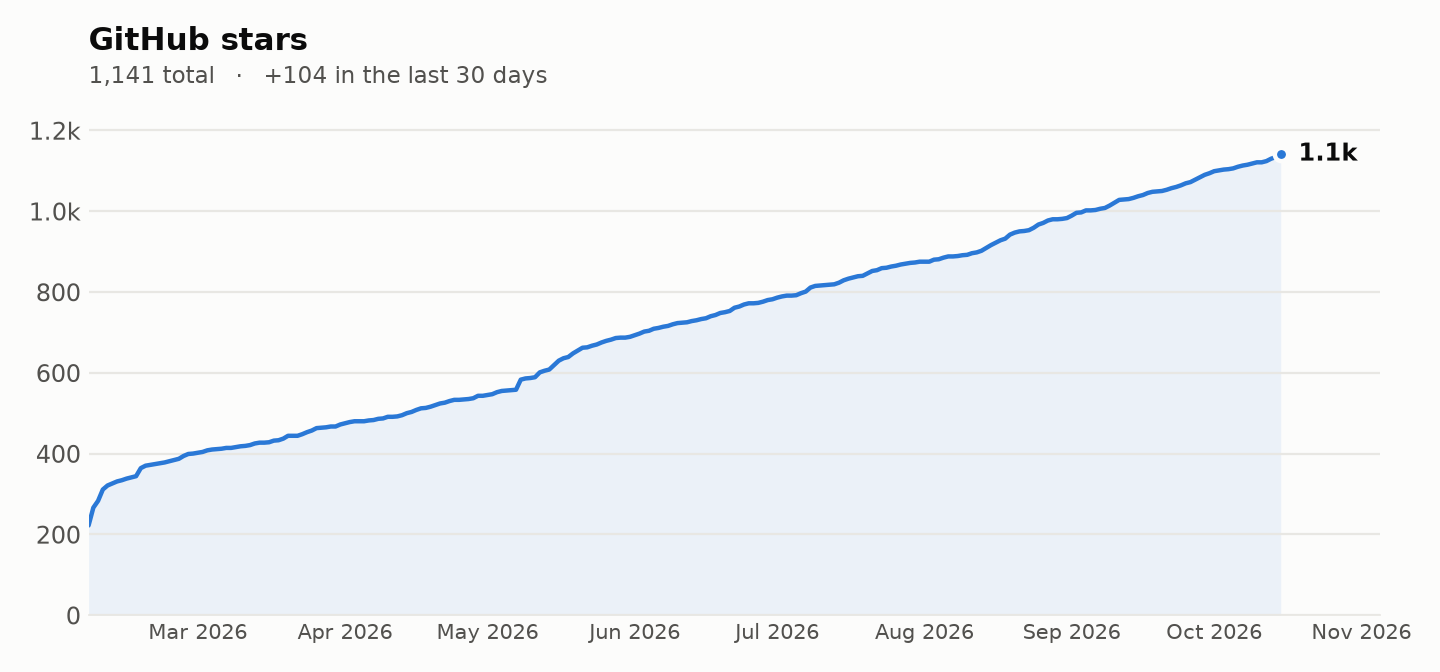
| GitHub stars | 1,141 | |
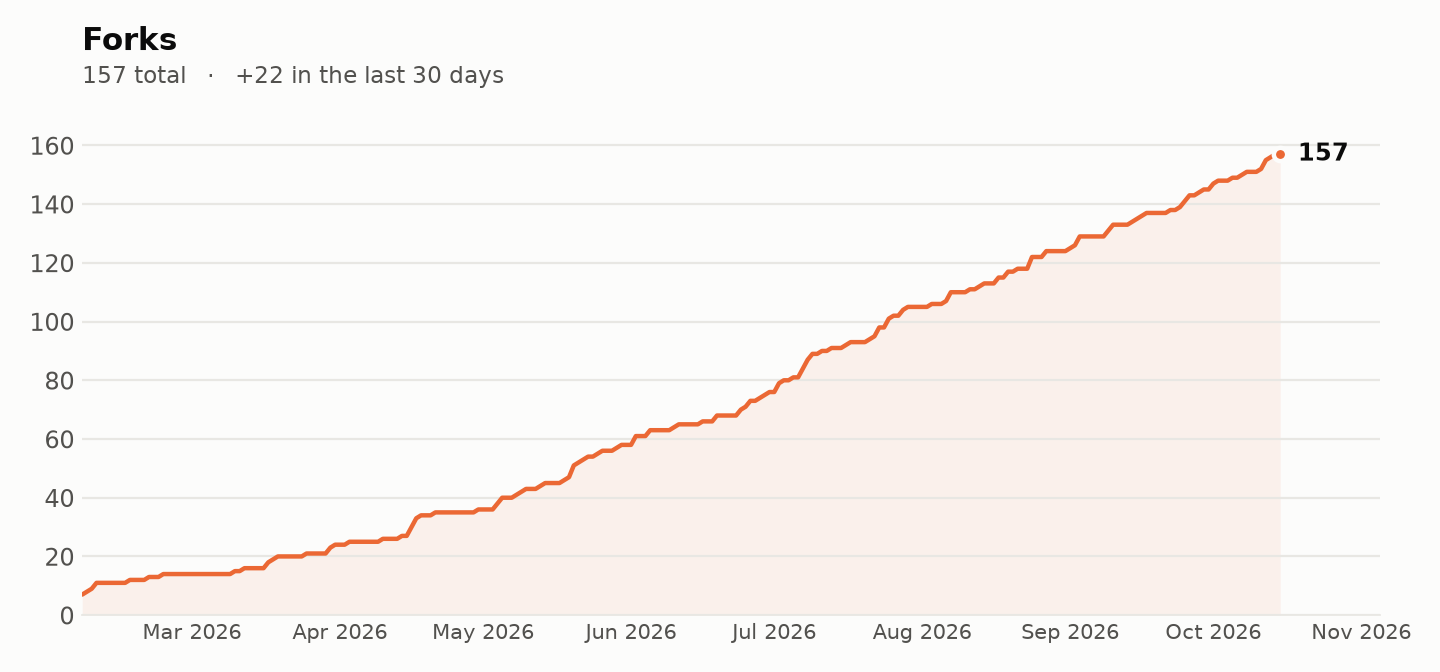
| Forks | 157 | |
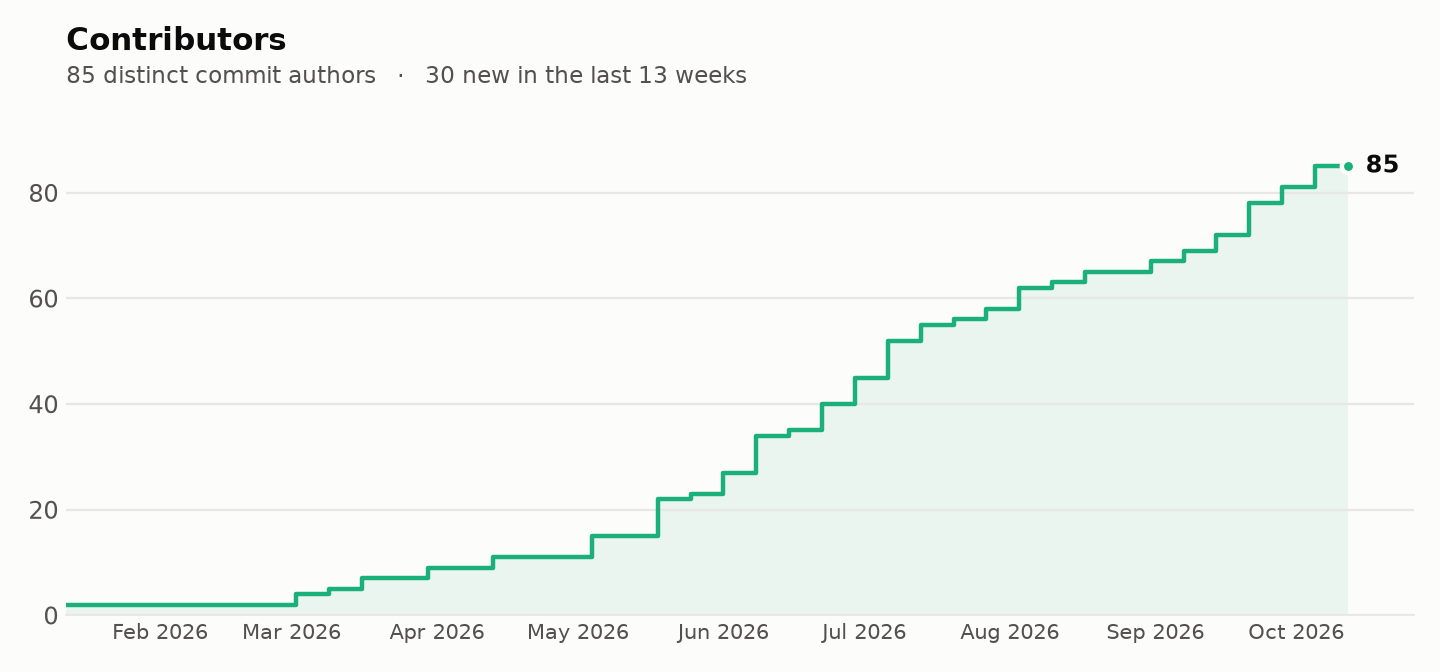
| Contributors | 74 | |
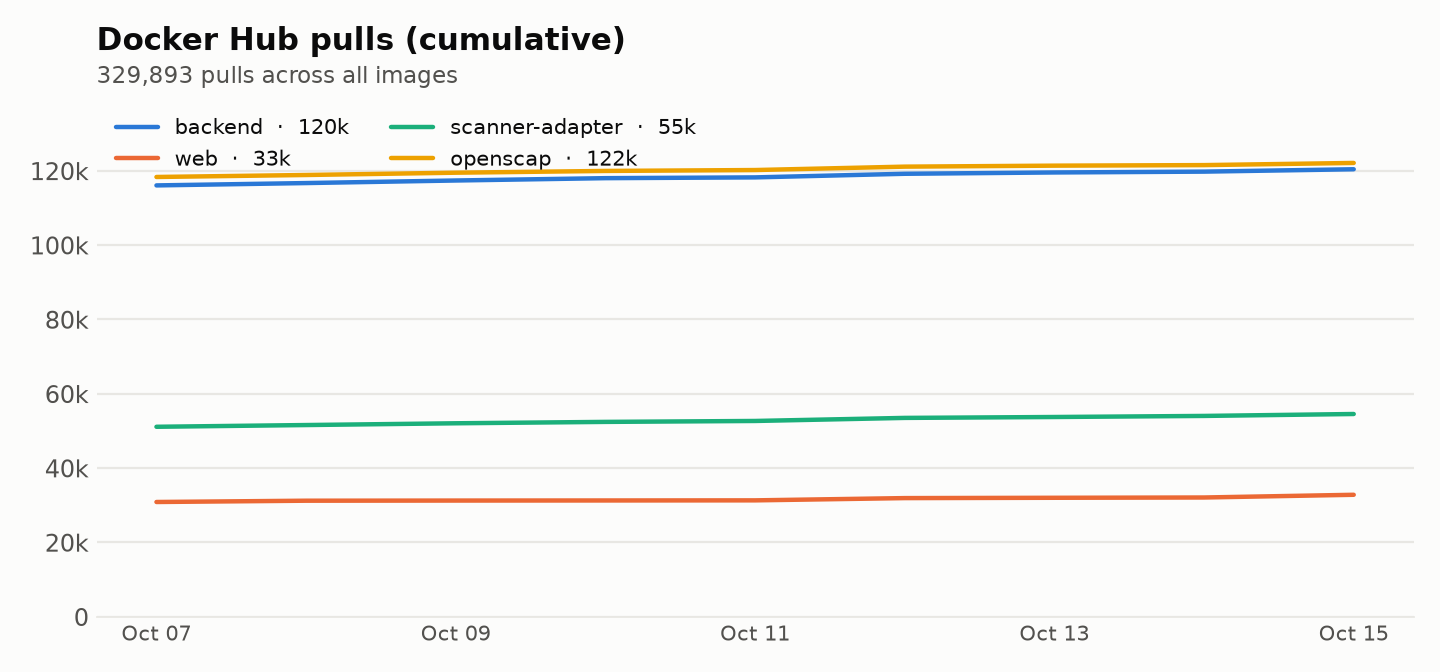
| Docker Hub pulls (all images) | 329,893 | |
Docker Hub pulls (backend) |
120,416 | |
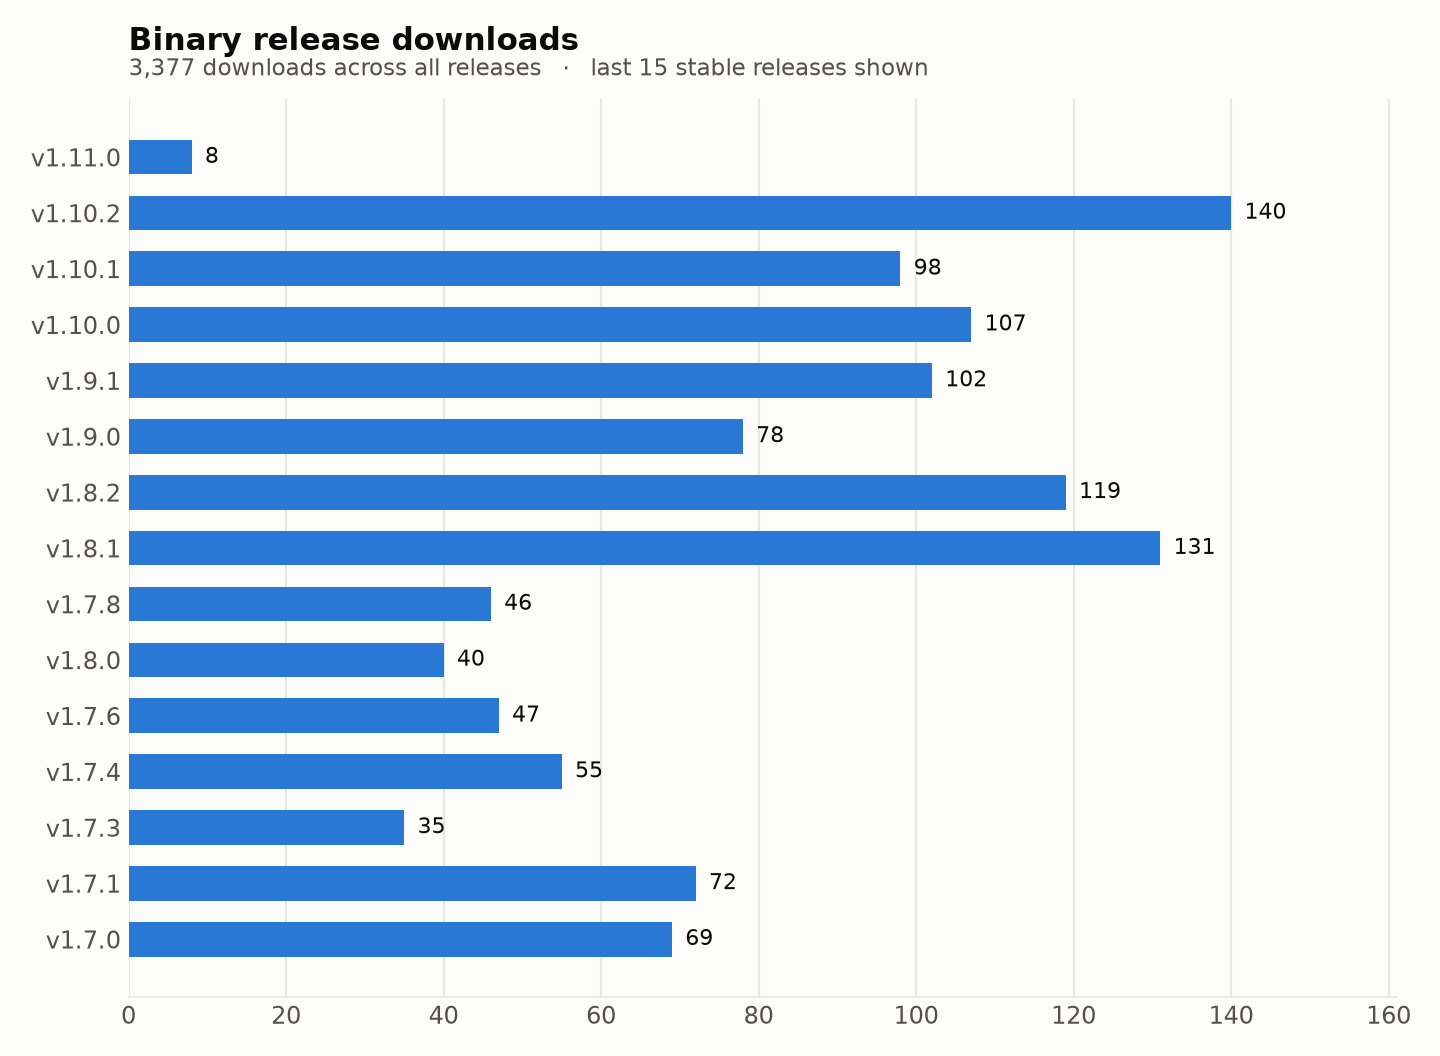
| Binary release downloads | 3,377 | |
| Stable releases shipped | 46 | |
| Merged pull requests | 2,170 | |
| Closed issues | 2,037 | |
| Discussions | 65 | |
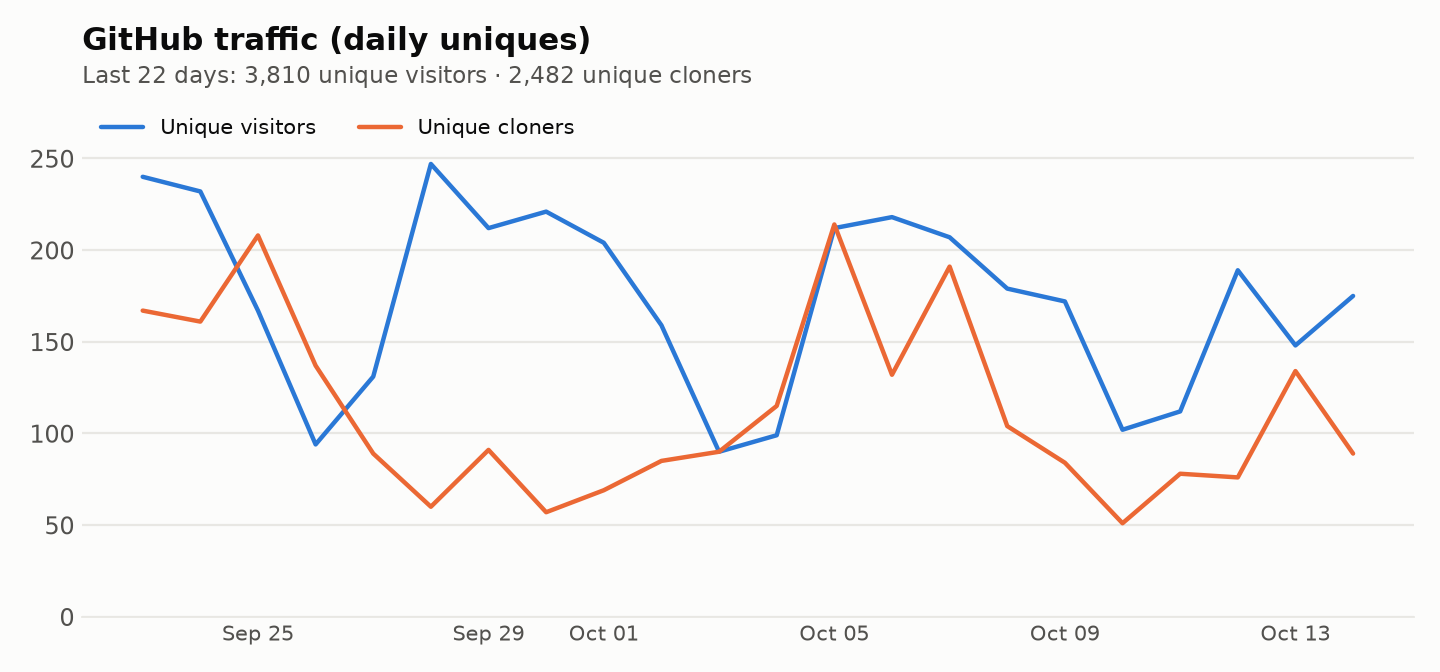
| Unique visitors, last 28 days | 3,810 | |
| Unique git cloners, last 28 days | 2,482 |
30-day change needs 30 days of snapshots; it fills in as history accumulates.


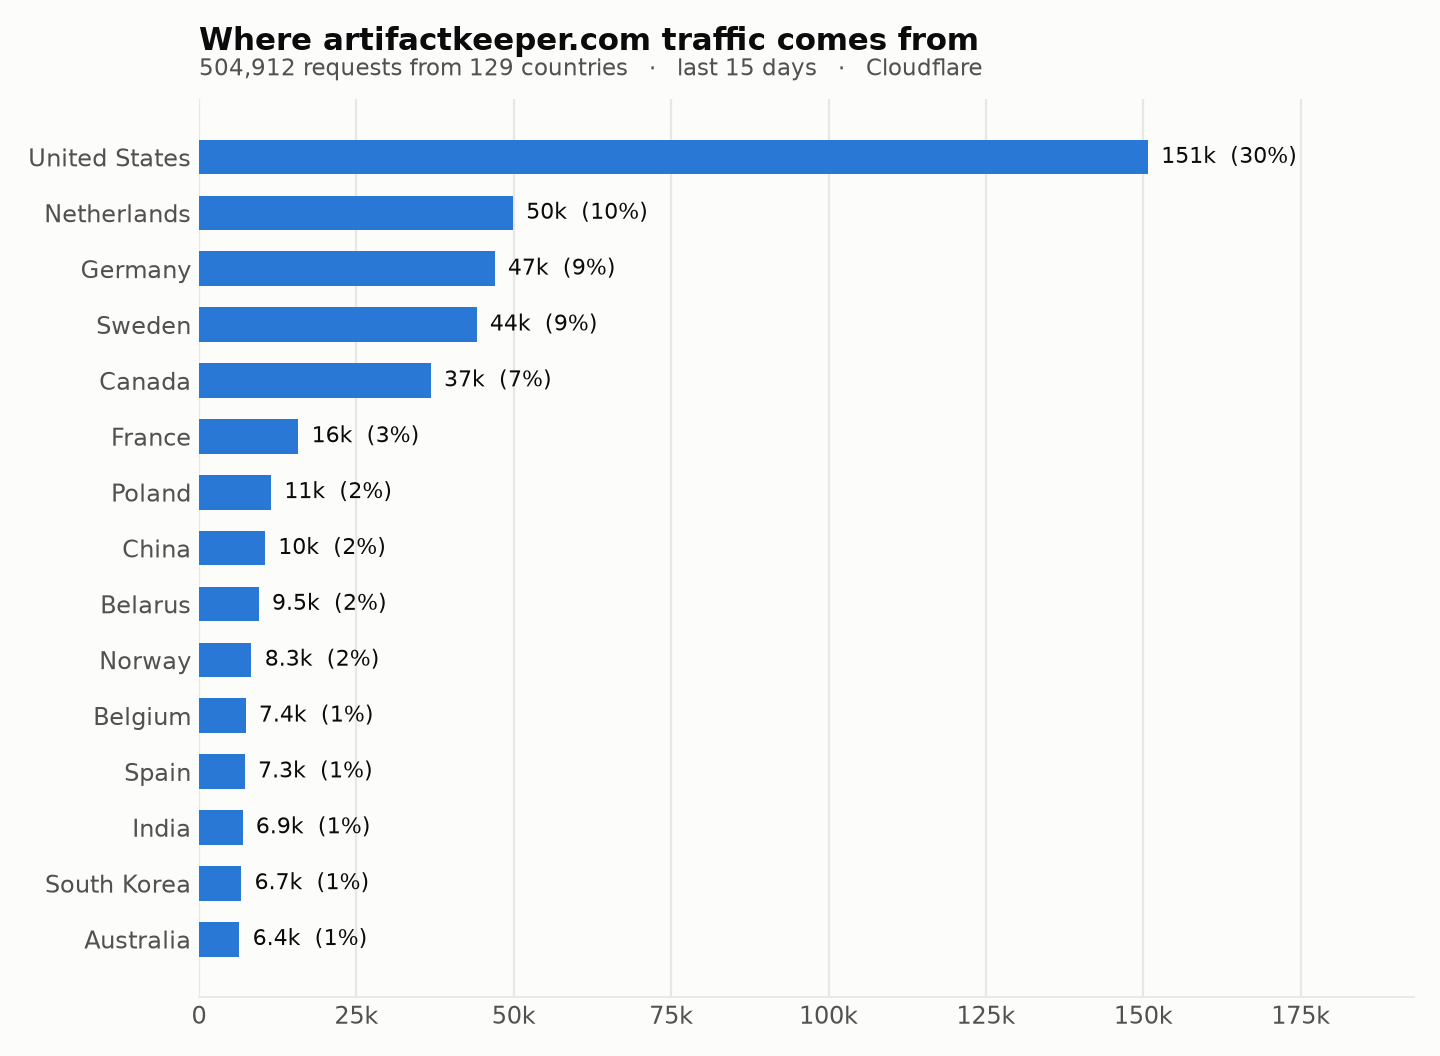
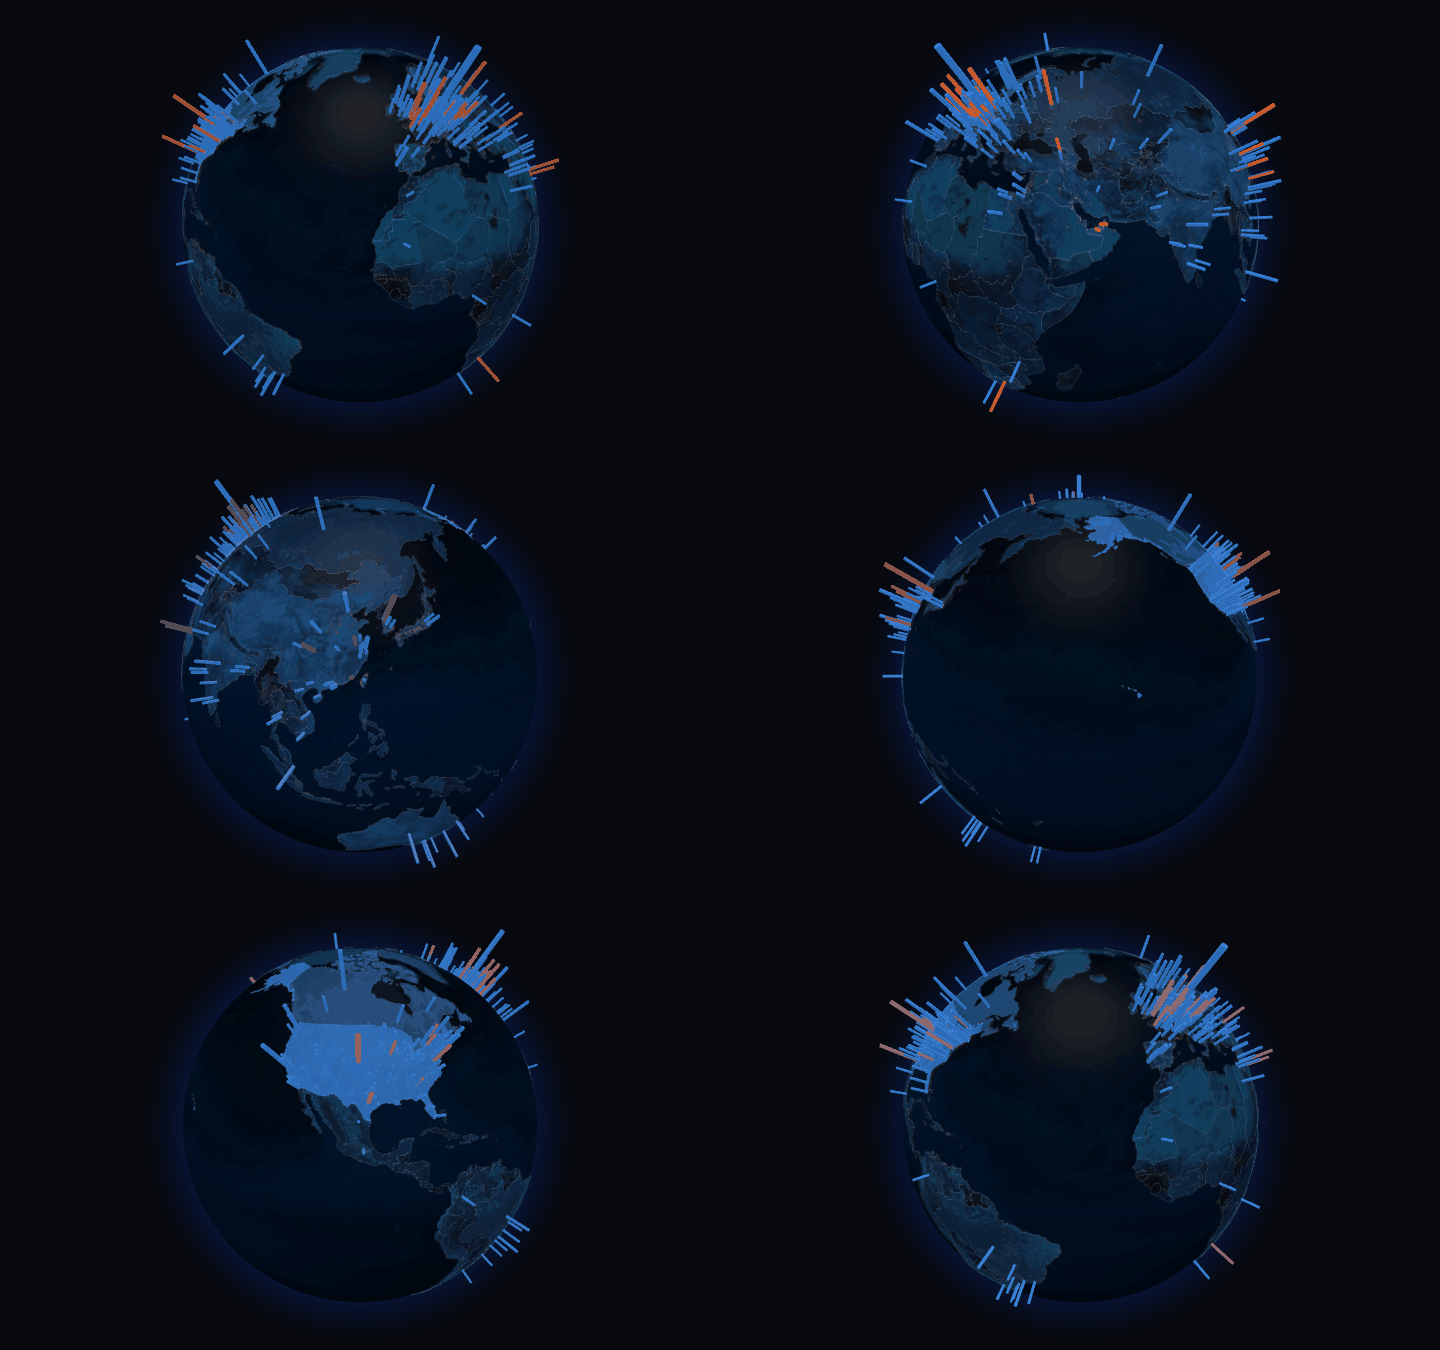
Where is the community? Heat map of stargazers, forkers and contributors by self-reported GitHub location, with countries shaded by website traffic. Click for the interactive globe.
Country totals are in data/artifact-keeper/countries.csv.
Individual charts
Add a [[projects]] block to config.toml with the GitHub repo and any Docker Hub
images, then run the workflow. Traffic (views, clones) needs the STATS_TOKEN secret to have push
access to that repo; everything else works with public API access.
uv sync
uv run ak-stats all            # collect + charts + readme
uv run ak-stats charts         # re-render charts from existing data