
netbox-opentelemetry-plugin exports NetBox telemetry (logs, audit records, traces and metrics) over OTLP to an OpenTelemetry Collector, directly from inside the NetBox processes (web workers, RQ workers, RQ work-horses). Each signal is an independent module, switched on or off in configuration.
| Signal | Default | Description |
|---|---|---|
| Logs | on | NetBox's Python logs, exported through the OTel Logs API. |
| Audit records | on | One structured record per ObjectChange (create, update, delete). |
| Traces | off | Spans for Django requests, PostgreSQL, Redis, outbound HTTP and RQ jobs. |
| Metrics | off | HTTP and job metrics, change counters, optional process runtime metrics. |
Taken in Grafana from the dev stack's ui profile (make dev-ui). Any OTLP backend works, through a Collector or with the exporter pointed at it directly.
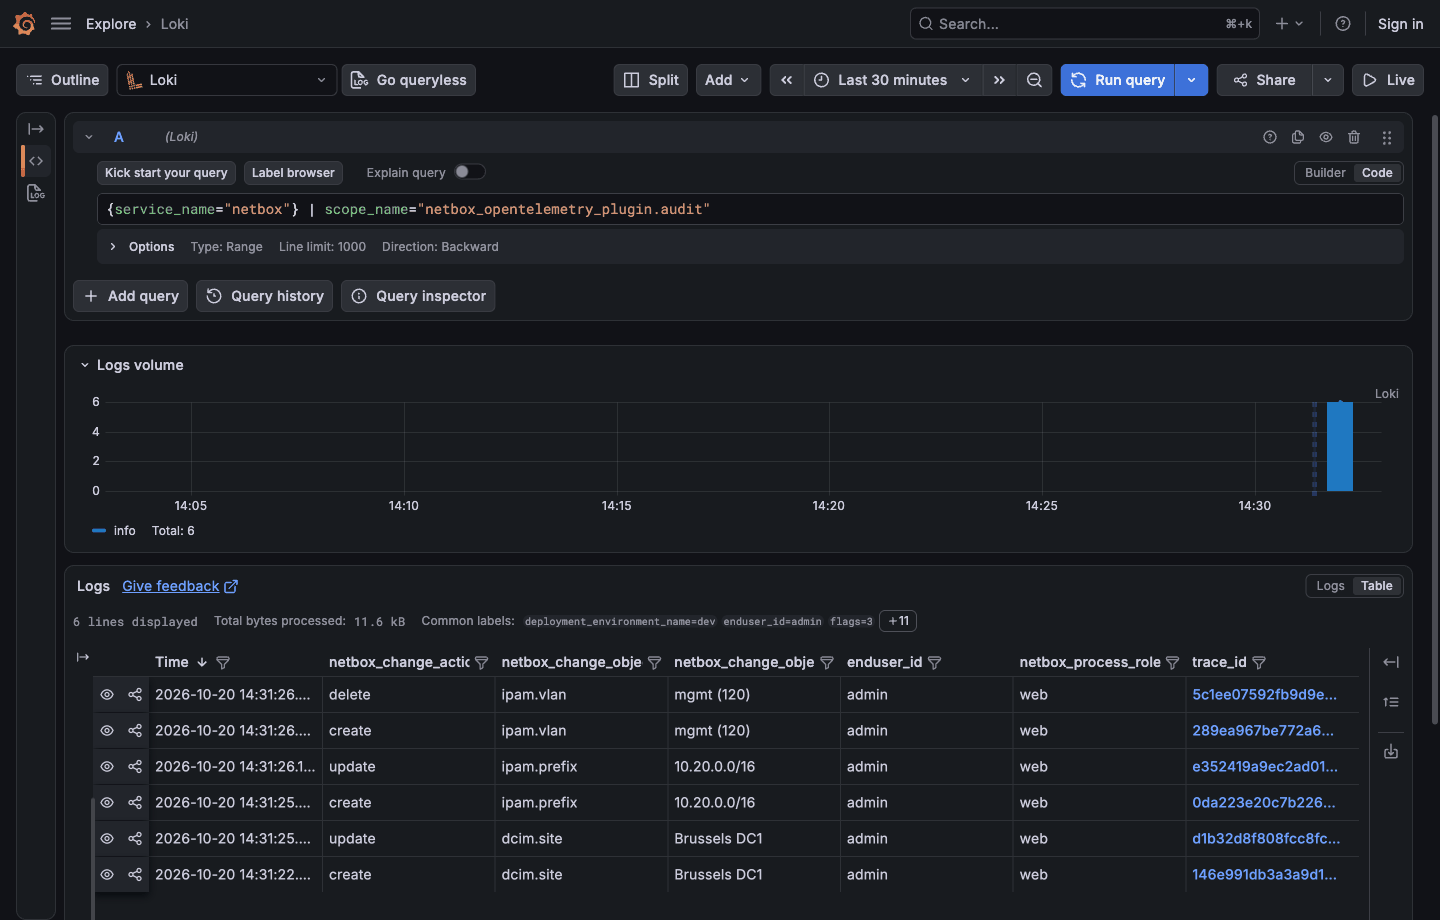
Audit records in Loki, one per ObjectChange, with the change and the user as attributes, and the trace id of the request:
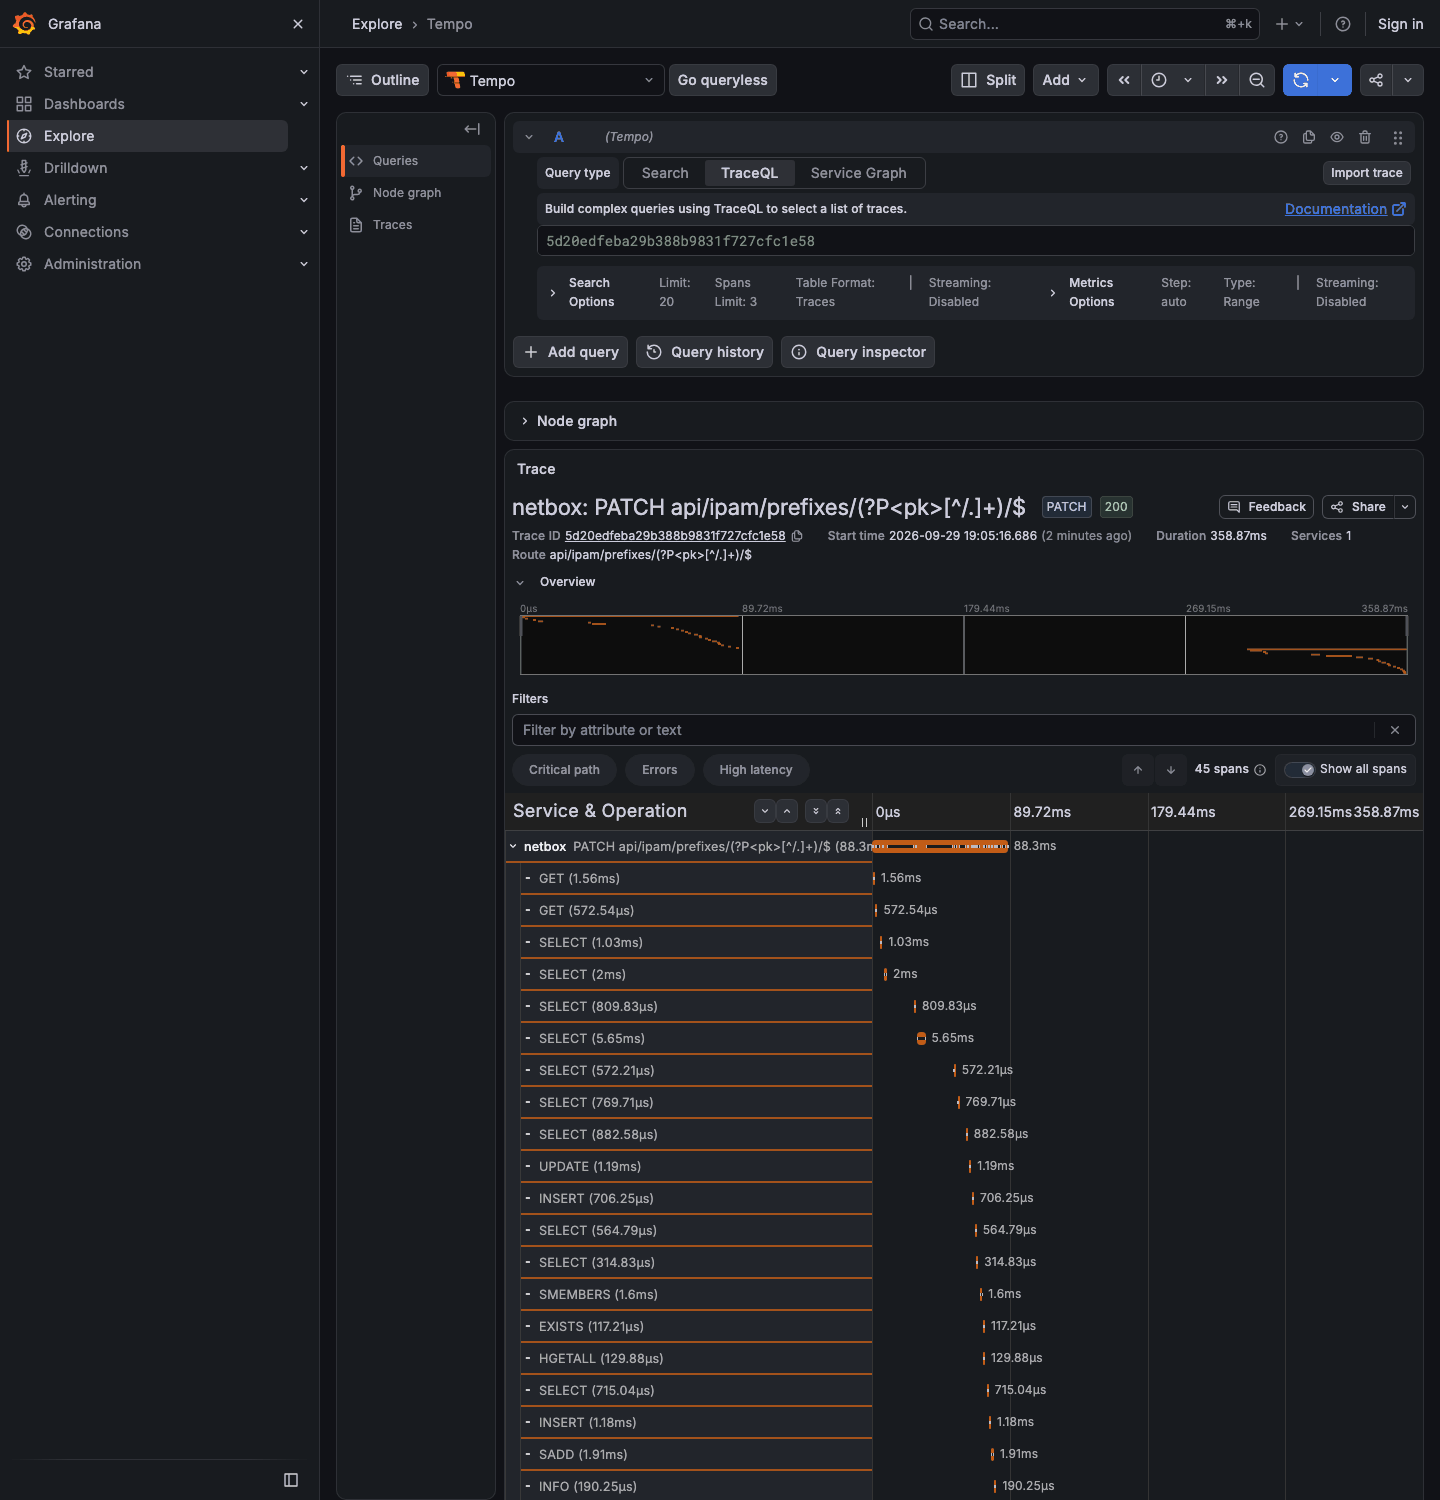
A REST API request trace in Tempo, with its PostgreSQL and Redis spans:
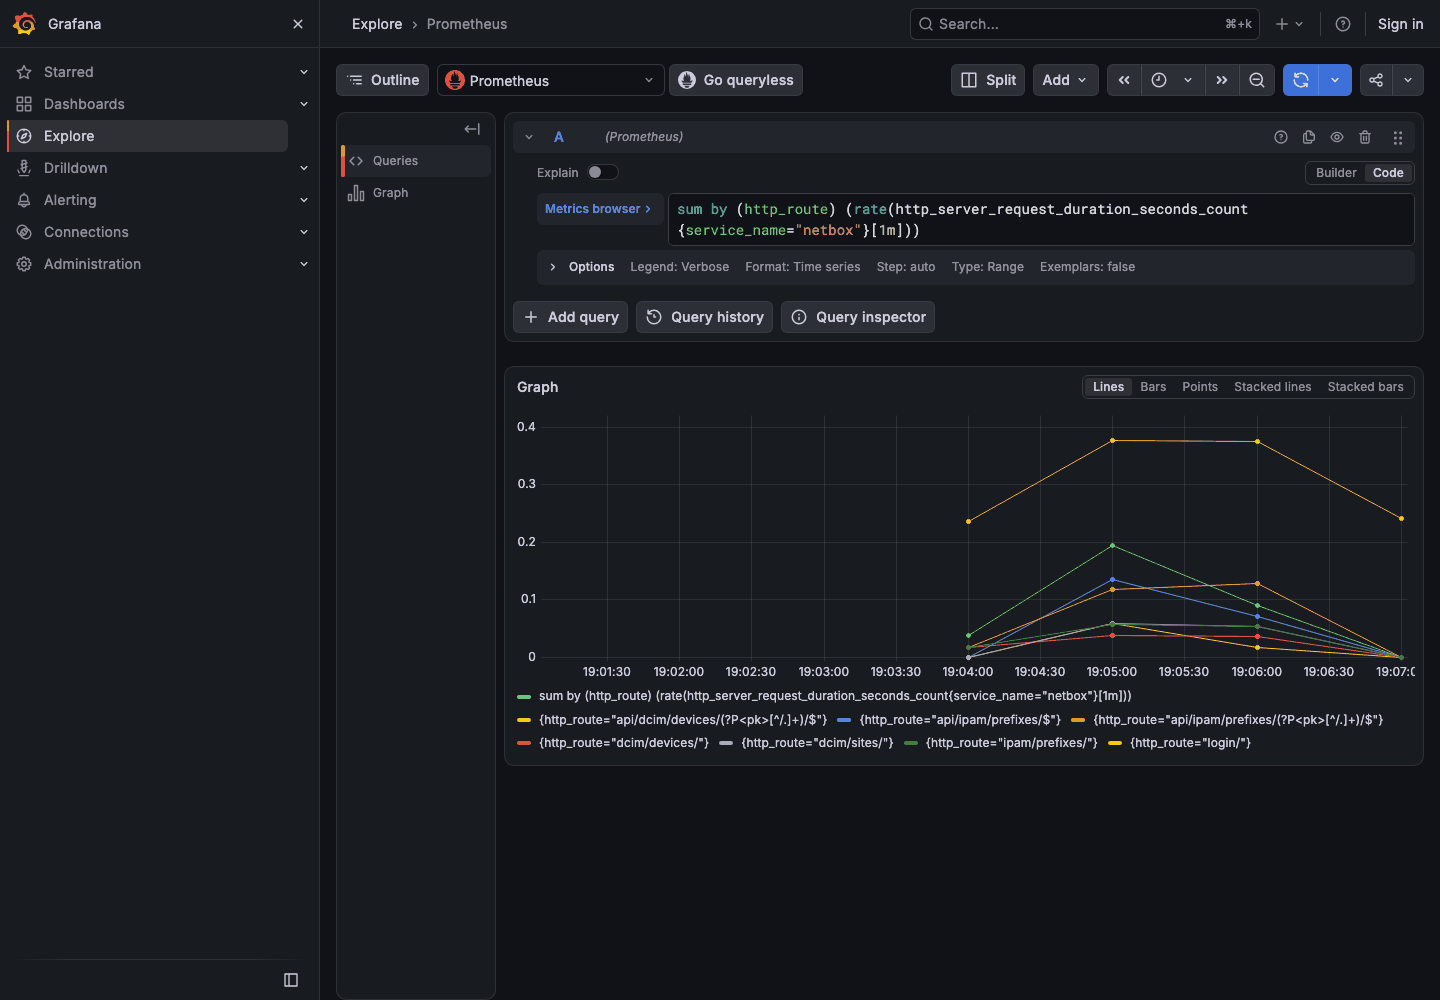
HTTP server request rate per route in Prometheus:
| Plugin | NetBox | Python |
|---|---|---|
| 0.4.x | 4.7.2 to 4.7.x | 3.12, 3.13, 3.14 |
| 0.1.x to 0.3.x | 4.7.0 to 4.7.x | 3.12, 3.13, 3.14 |
min_version = "4.7.2" and max_version = "4.7.99" in the plugin's PluginConfig enforce this NetBox range; NetBox refuses to load the plugin outside it. NetBox 4.7.0 and 4.7.1 recorded plaintext API tokens created through background bulk requests in job results, fixed in 4.7.2. On those versions, upgrade NetBox before upgrading the plugin, or stay on 0.3.x: NetBox skips a plugin whose min_version is above its own version with a warning, and nothing is exported.
Installing the package pulls in these OpenTelemetry packages, no others:
opentelemetry-api~= 1.44.0opentelemetry-sdk~= 1.44.0opentelemetry-exporter-otlp-proto-http~= 1.44.0opentelemetry-exporter-otlp-proto-grpc~= 1.44.0opentelemetry-instrumentation-django== 0.65b0opentelemetry-instrumentation-psycopg== 0.65b0opentelemetry-instrumentation-redis== 0.65b0opentelemetry-instrumentation-requests== 0.65b0opentelemetry-instrumentation-system-metrics== 0.65b0
No NetBox model, no database migration and no UI of its own.
Install the package into the NetBox virtual environment:
source /opt/netbox/venv/bin/activate
pip install netbox-opentelemetry-plugin
netbox-docker's venv has no pip, only uv: use uv pip install netbox-opentelemetry-plugin in a custom image built on top of the upstream one. See the installation page for netbox-docker, the Helm chart, and bare metal gunicorn and uWSGI.
Enable the plugin in configuration.py:
PLUGINS = ["netbox_opentelemetry_plugin"]
PLUGINS_CONFIG = {
    "netbox_opentelemetry_plugin": {
        "exporter": {"endpoint": "http://otel-collector:4318"},
    },
}
Turn on traces and metrics too:
PLUGINS_CONFIG = {
    "netbox_opentelemetry_plugin": {
        "exporter": {"endpoint": "http://otel-collector:4318"},
        "traces": {"enabled": True},
        "metrics": {"enabled": True},
    },
}
Restart the NetBox web processes and the RQ workers to pick up the change.
- Full documentation
- Installation
- Configuration reference
- Logs, audit records, traces, metrics
- How it works
- Data safety
- Failure behaviour
- Collector on Kubernetes
- Limitations
- Changelog
Apache 2.0. See the LICENSE file.